Understanding the Force Index Indicator
Introduction
The most interesting and crucial moments as a trader are the periods when the bulls and bears more or less balance each other out. Rising prices alternate with falling ones, several times in a row. This gives rise to so-called sideways price ranges (which give the long-term trend investor sleepless nights..). Going long or short when these sideways ranges are broken on the up or down side (and speculating on a continuation of the trend in the direction of the breakout) can be very lucrative low-risk setups.... However, anyone who has ever used a breakout strategy undoubtedly knows what the main problem with this strategy is. The false breakouts. At first, the price breaks through but the movement does not continue. The price then falls back into the existing sideways price range.
Blindly buying or selling breakouts or breakdowns is certainly not the way to become successful in the long run with such a strategy... And yet this still happens far too often by mainly inexperienced traders.
The Force Index Indicator by Alexander Elder
The Force Index indicator can be a useful tool in this respect. The Force Index Indicator, developed by Alexander Elder, uses price change in combination with volume to identify the strength of a price movement. The author argues that every price movement has three components, each of which plays an important role in itself in order to evaluate the price movement as correctly as possible. Direction, Extent, and Volume.
- Direction : the direction the price is moving, is it consistent with the existing long-term trend or is the price movement more of a countertrend move?
- Extent: this has to do with the strength of the movement itself, or in other words the momentum. A sudden rise of 4% with an average price movement (volatility) that is lower than 1%, is a totally different story than the same rise of 4% where the average volatility of the stock is 3% anyway...
- Volume: The number of shares traded during that period of price movement. A breakout with high volume tells us that buying is being done with confidence while a breakout with no signs of rising volume is to be avoided.
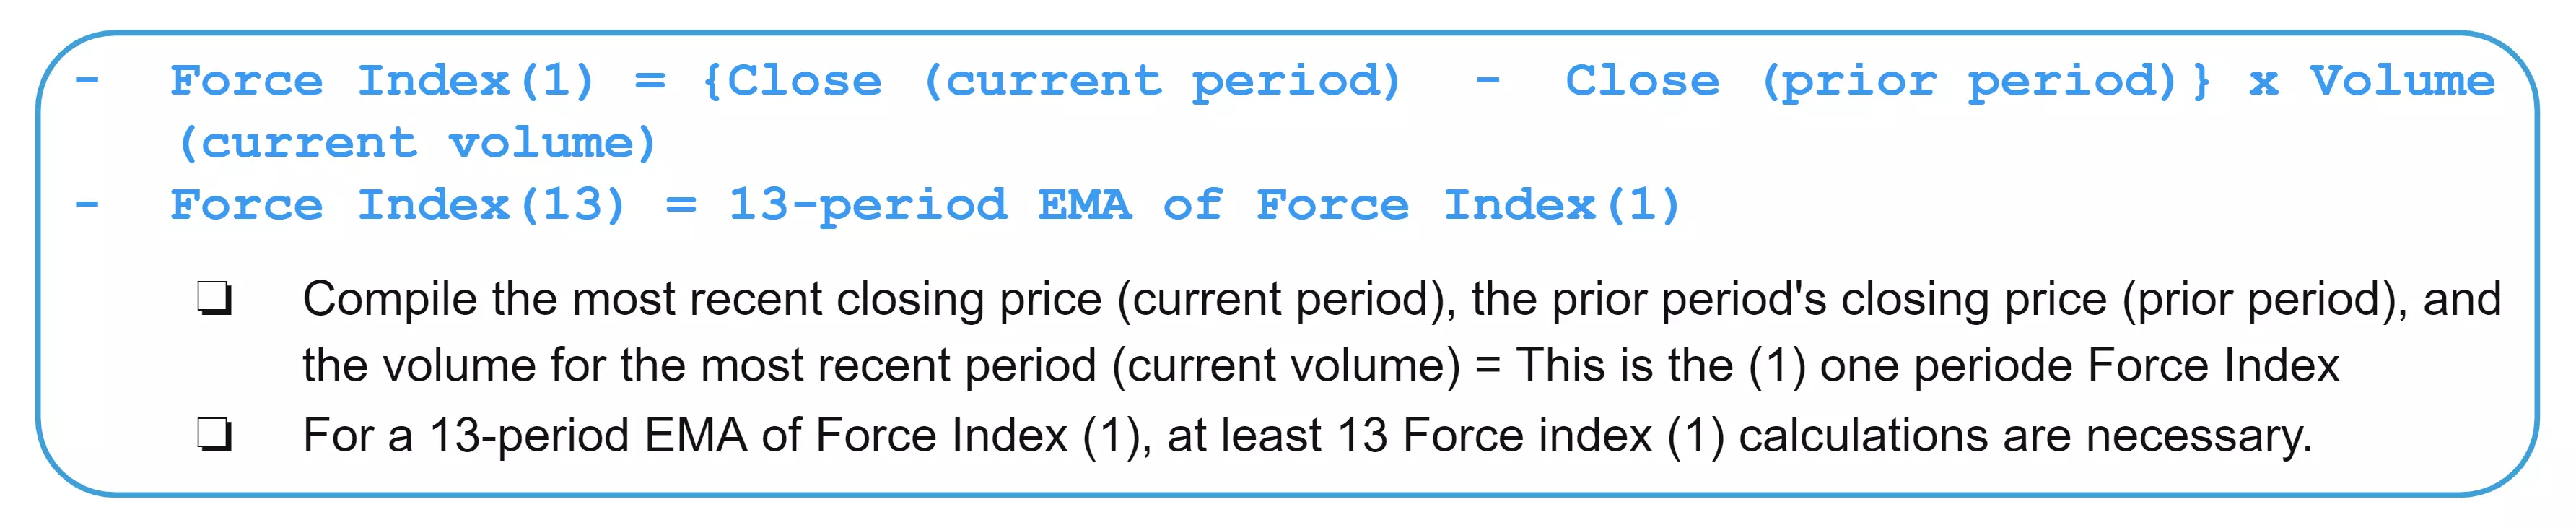
The Formula
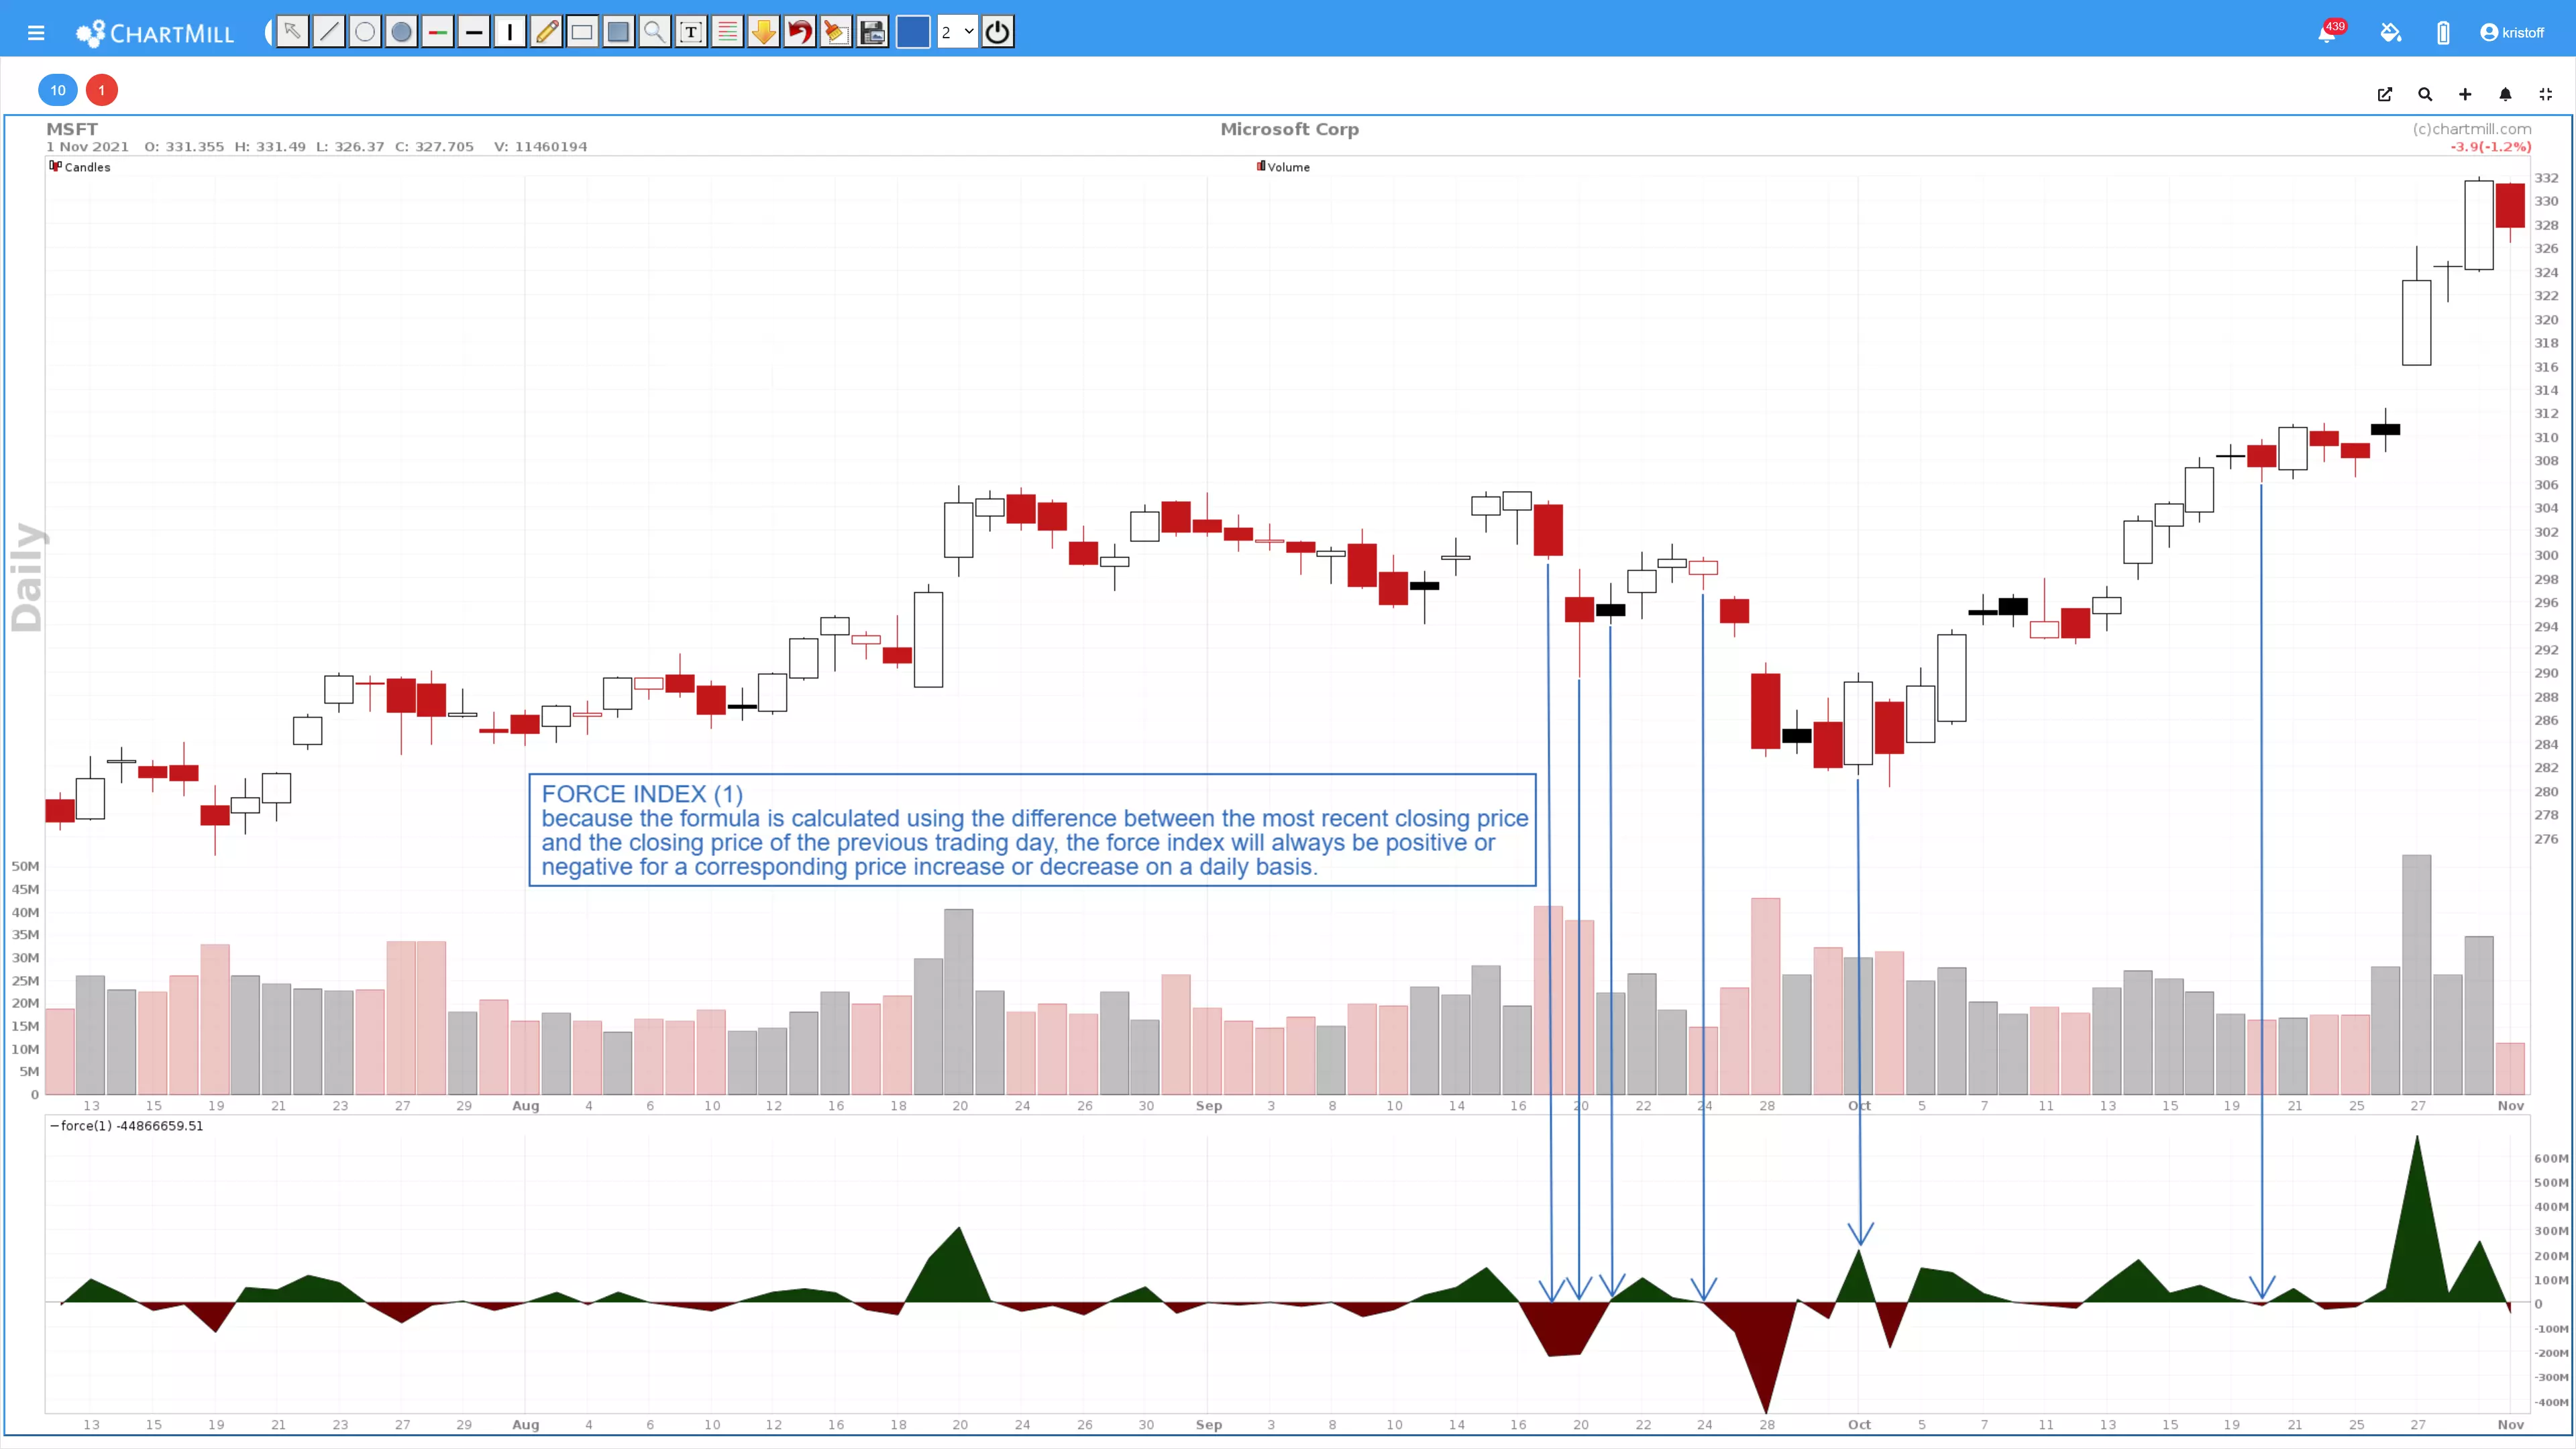
Daily chart of Microsoft with the Force Index Indicator (1 day period)
Force Index as a trading signal and/or trend indicator
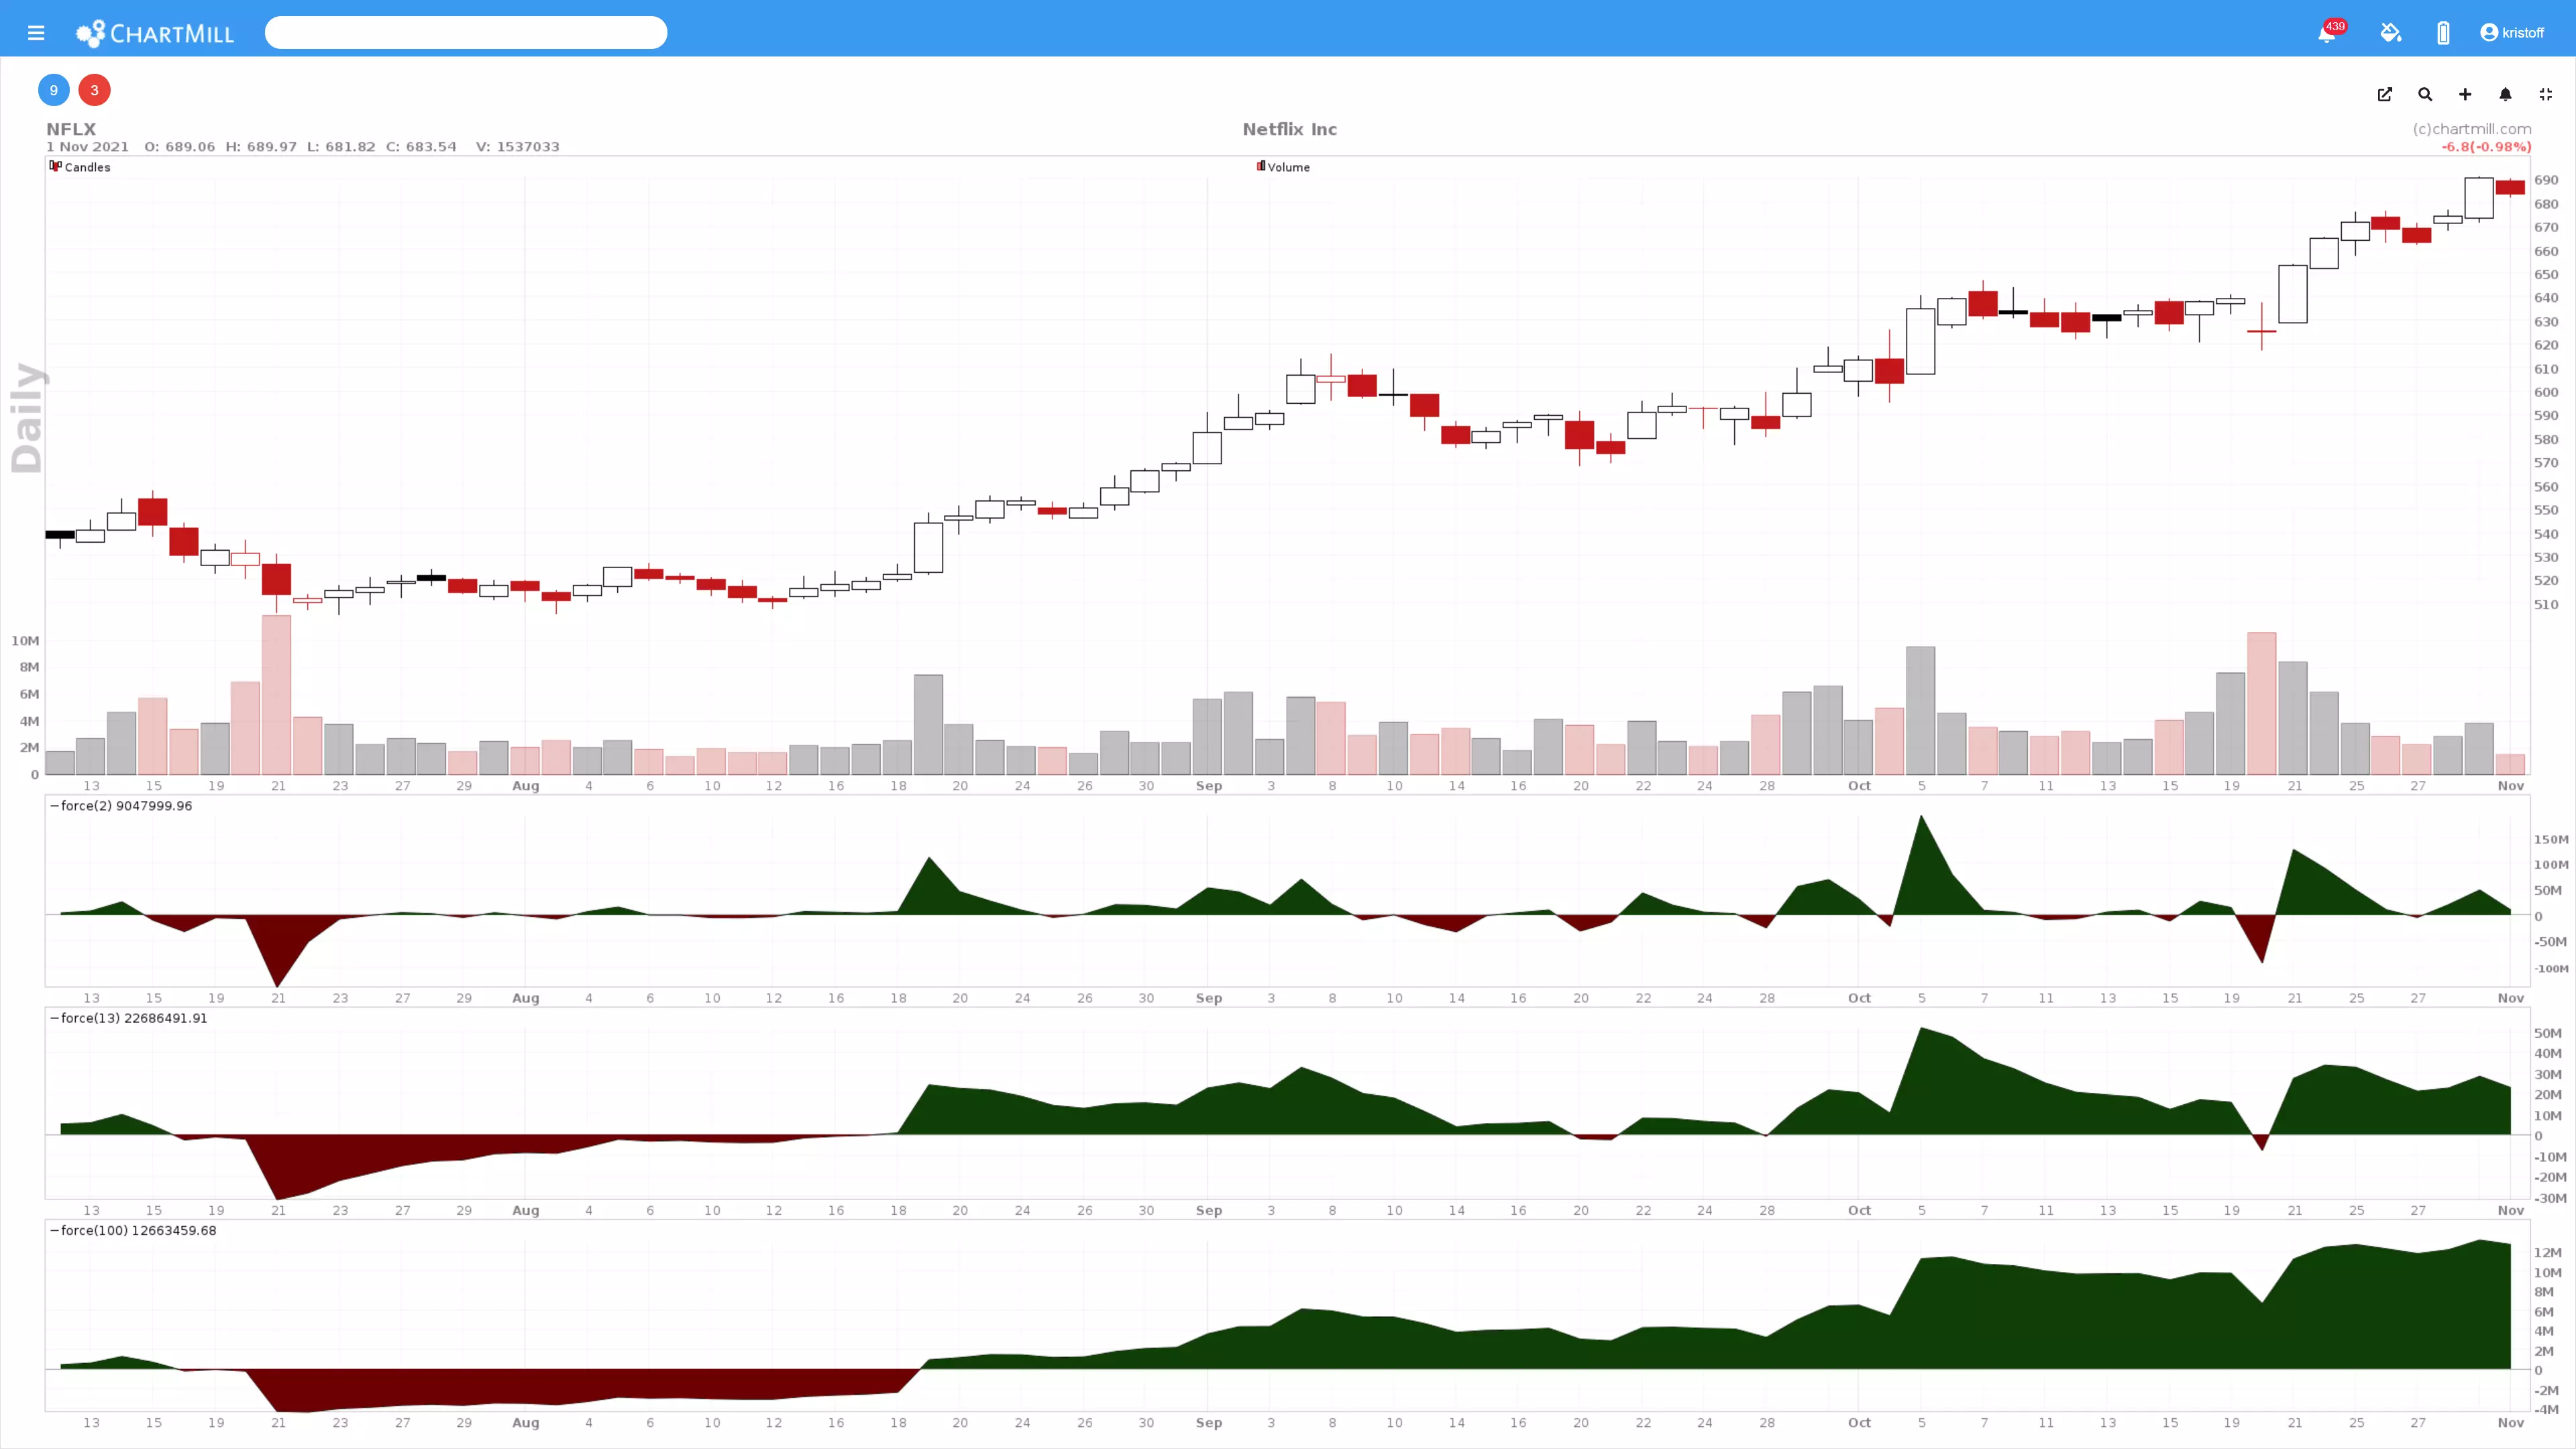
In general, combinations of several Force Index indicators over different periods are often used. Force Index (2) for the ultra-short term where the indicator is used as an entry signal (rising above zero for longs, falling below zero for short positions). A Force Index (13) as a basic trend indicator. But also, for example, a Force Index of 100 for determining the long-term trend.
Interpreting the Force Index correctly.
Large peaks or valleys in the Force Index indicate that both the total price movement, and/or the volume with which it occurs, is high. However, because of the simplicity of the formula, the same outcome is possible while the basic parameters are different.
See this example :
closing price today $22 (volume 1000 shares) yesterday's closing price $20 Applying the formula gives: 22-20 = 2 *1000 = 2000 - this is the Force Index (1) value.
but also:
closing price today $24 (volume 500 shares) closing price yesterday $20)
The same formula now gives: 24-20 = 4*500 = 2000 - this is the same Force Index (1) value while the closing price and volume were totally different.
So it remains important to look at both price and volume separately to draw the right conclusions. A clear closing price above a significant resistance level where the price closes at +3% with 100% more volume than the day before is more relevant than a rise of 4.5% but less volume. Always take this into account when interpreting the indicator.
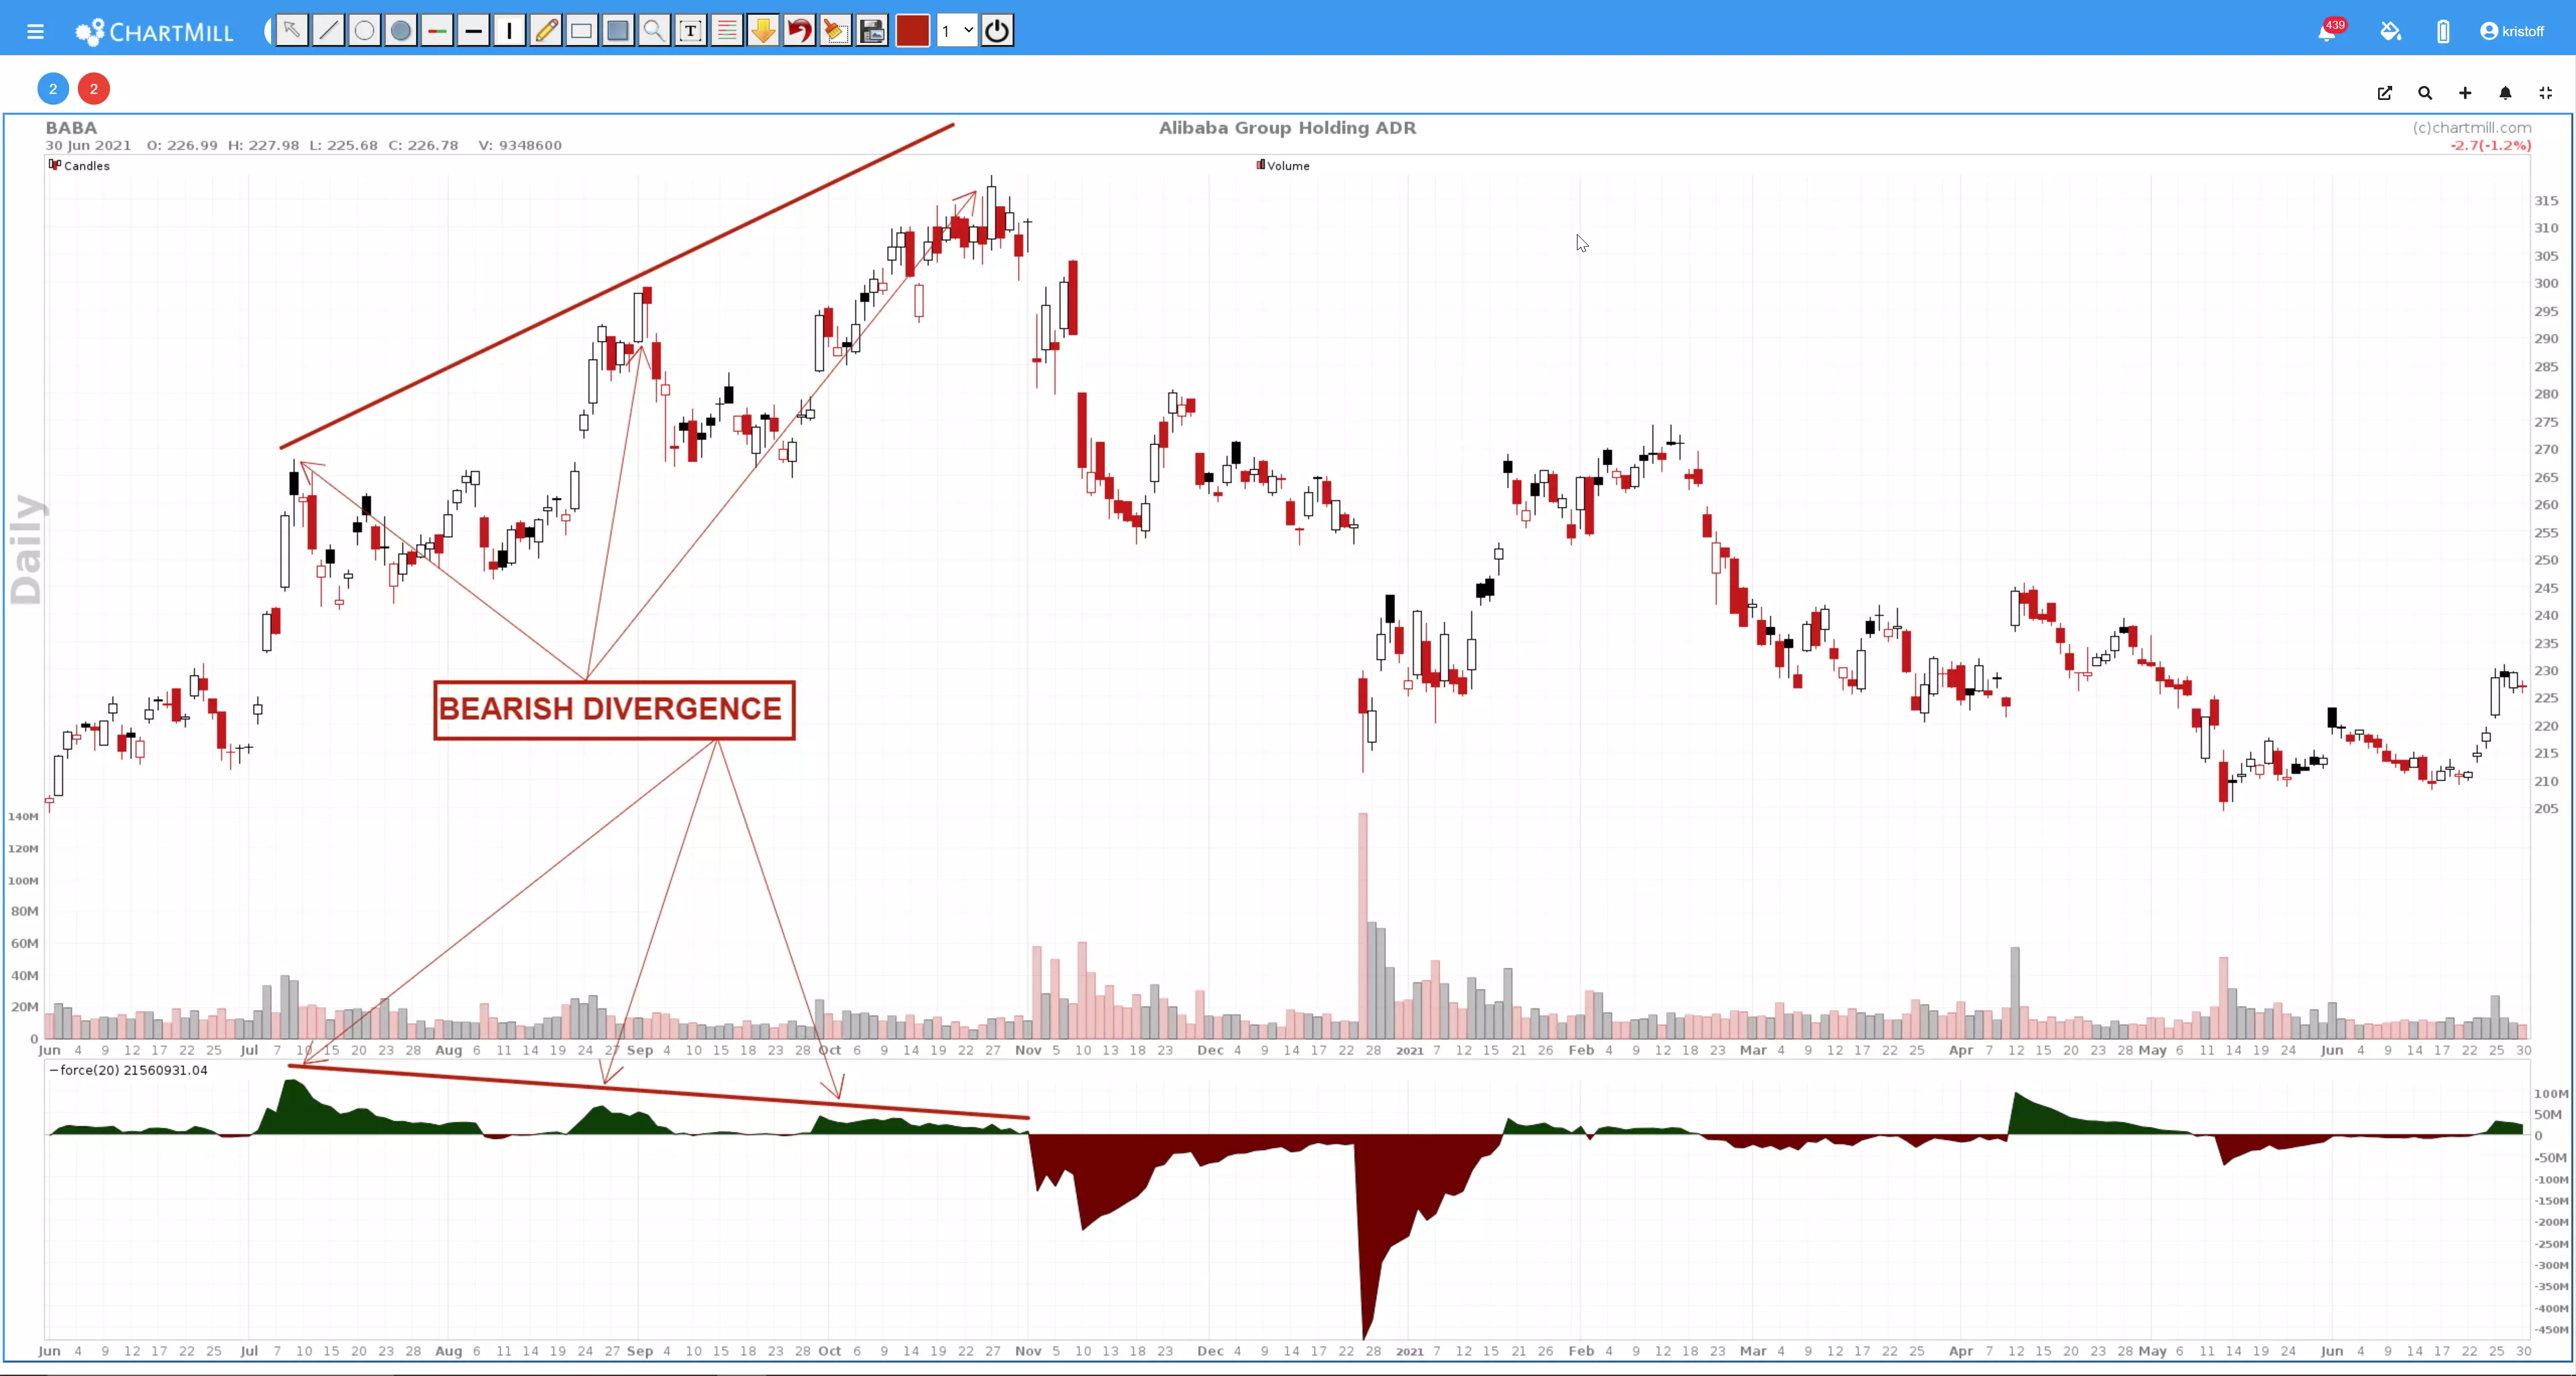
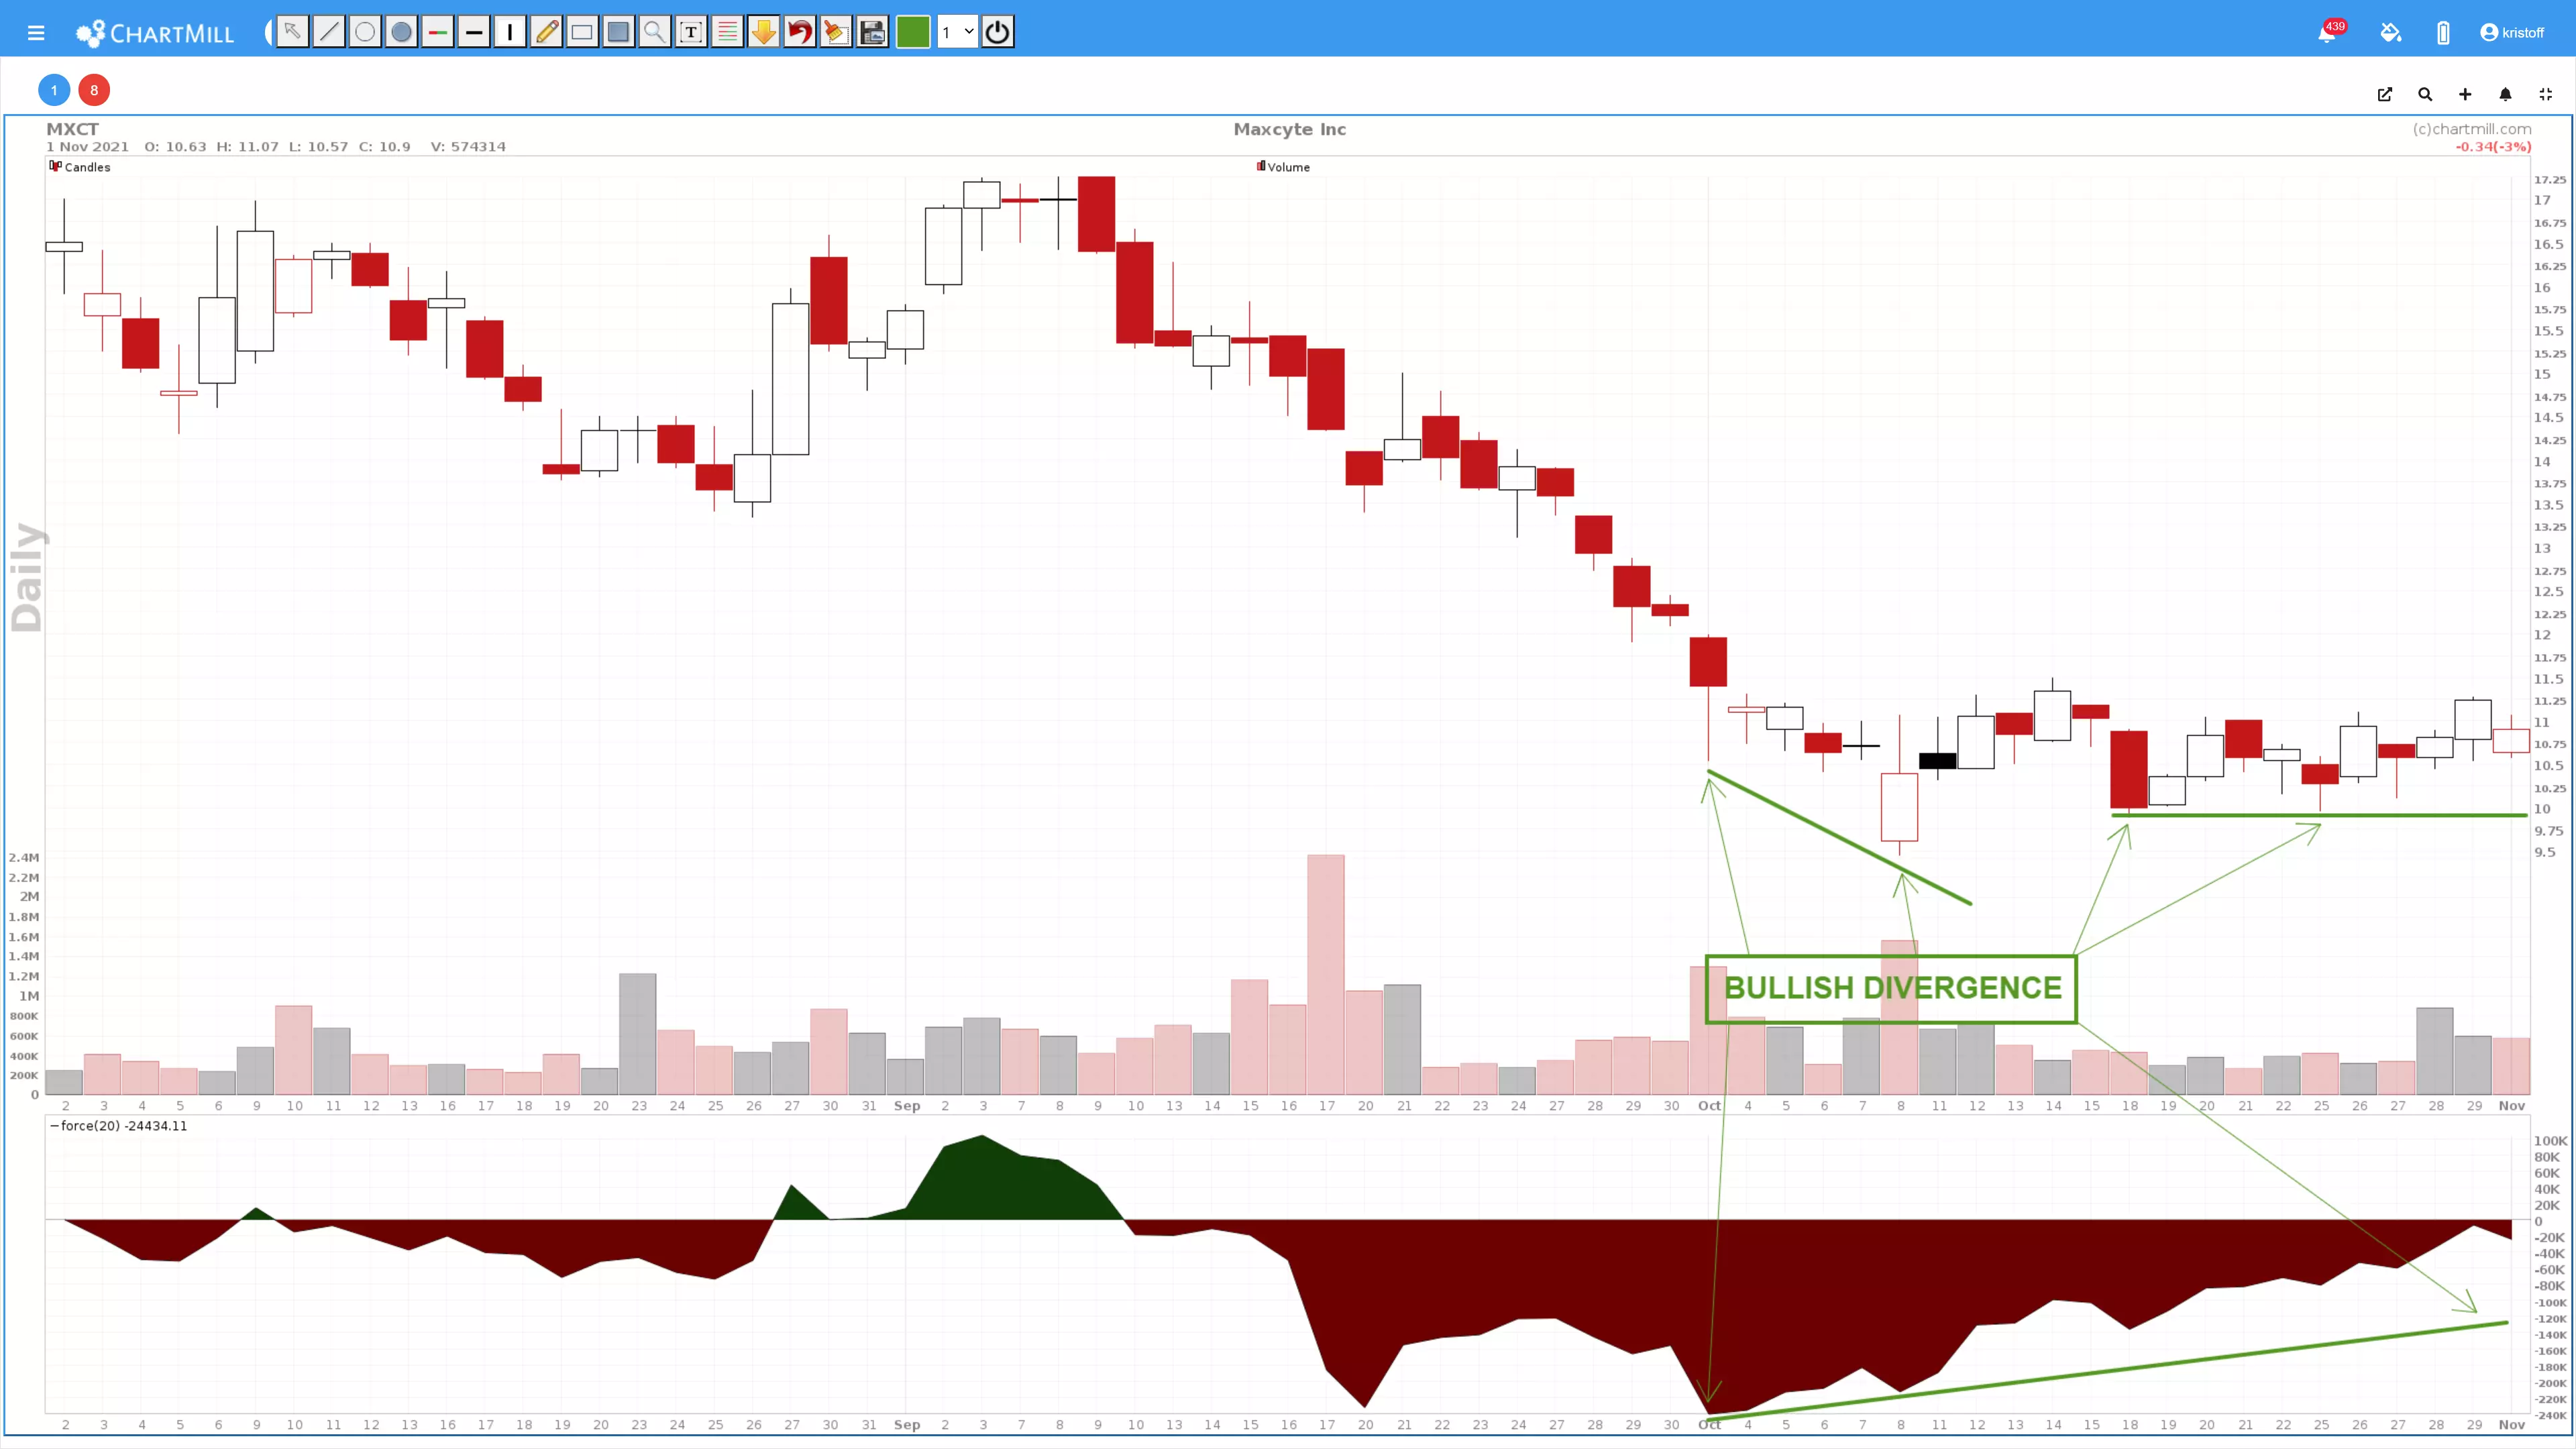
Divergence between the price and the Force Index oscillator
As with all other oscillators, the Force Index is an indicator where there can be divergences between the price and the oscillator.
Higher price tops but lower tops in the Force Index indicator are an indication that the trend is weakening, this is called a bearish divergence signal. This can be a temporary phenomenon but it can also indicate the start of a real trend reversal. Such divergences should never be used as entry signals by themselves but the presence of a bearish divergence signal can be used to tighten the existing stoplosses in order to secure a larger portion of the outstanding profit.
Positive divergences also occur. Price is forming lower bottoms but the successive bottoms in the indicator are higher. Again, this should not be used as a buy-signal, but the stock may be placed in a watchlist and monitored for further signs of an impending trend reversal.
In a subsequent article, we will be looking at the different filter capabilities in ChartMill regarding this Force Index indicator. Furthermore, we'll go into a little more detail about some of the ways you can use the indicator as part of a trading strategy.