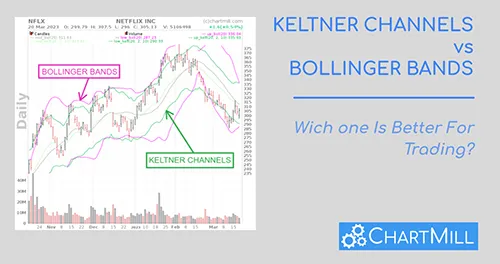
Keltner Channels vs Bollinger Bands: Which One Is Better For Trading?
Price Channels such as the Bollinger Bands and Keltner Channels are popular among active traders and investors because they provide valuable insights into the price trend and related momentum. Both indicators can be used to find specific entry points.
To take advantage of them and use them effectively in your own trading strategy, you need to recognize the different signals at an early stage and be able to interpret them correctly. In this article we compare both indicators and after reading you will know :
- What the similarities and differences are between these two
- When it is best to use one or the other
- How to use both indicators simultaneously in a specific trading strategy
About Bollinger Bands
How It Looks
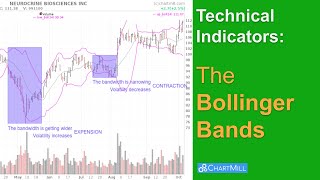
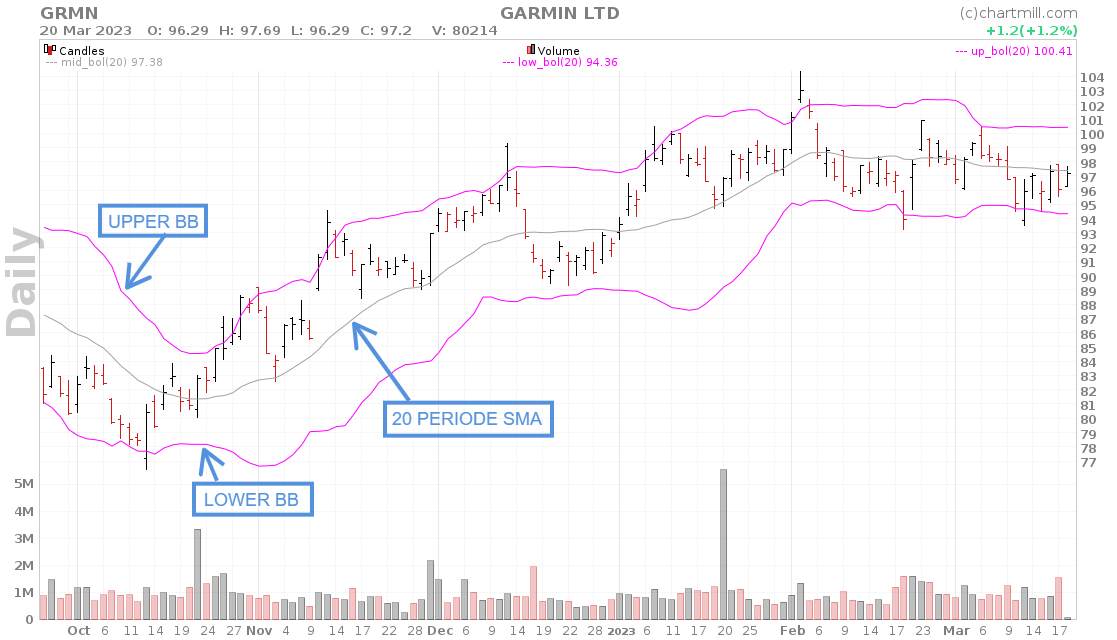
By default, Bollinger Bands are calculated based on a 20-day simple moving average. In the chart below, you will recognize it as the middle gray line.
The line above it is called the upper Bollinger Band and the one beneath the lower Bollinger Band. Both lines are calculated using a standard deviation based on the middle line. That standard deviation creates a dynamic field around the price and is used to represent the variation.
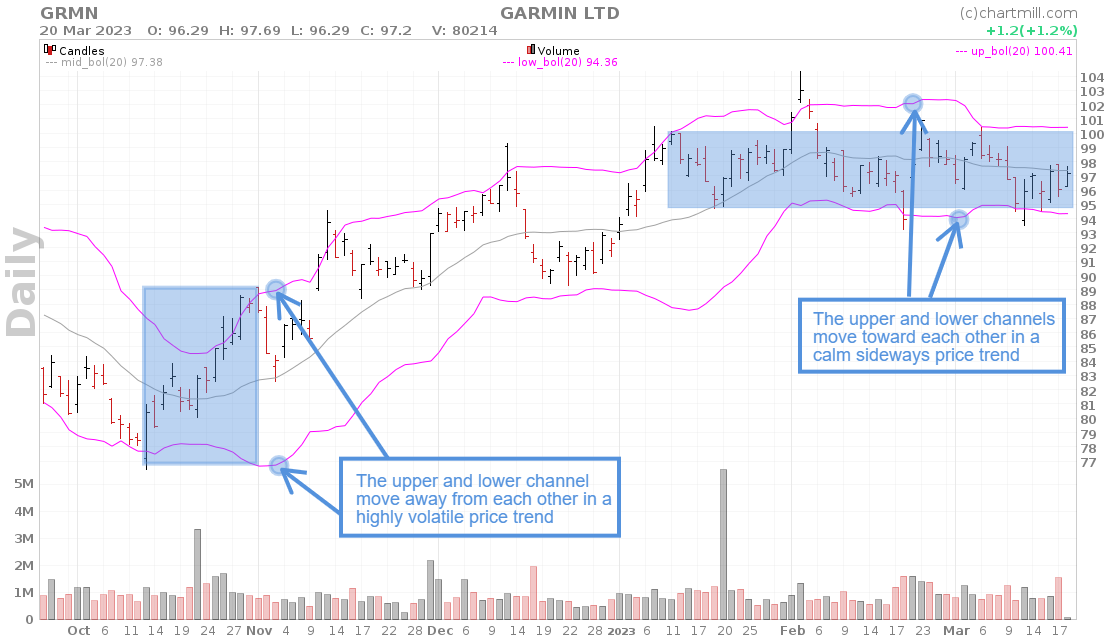
When market conditions are very nervous (volatile) this causes the upper and lower bollinger bands to move further apart as prices move harder up and down. The opposite happens when the stock market is calm. Stock prices do not move as fast, so the upper and lower bollinger bands move closer together.
How It’s Used
Bollinger bands are popular among swing and position traders and can be used in three different ways:
-
as a trend signal of a possible new trend
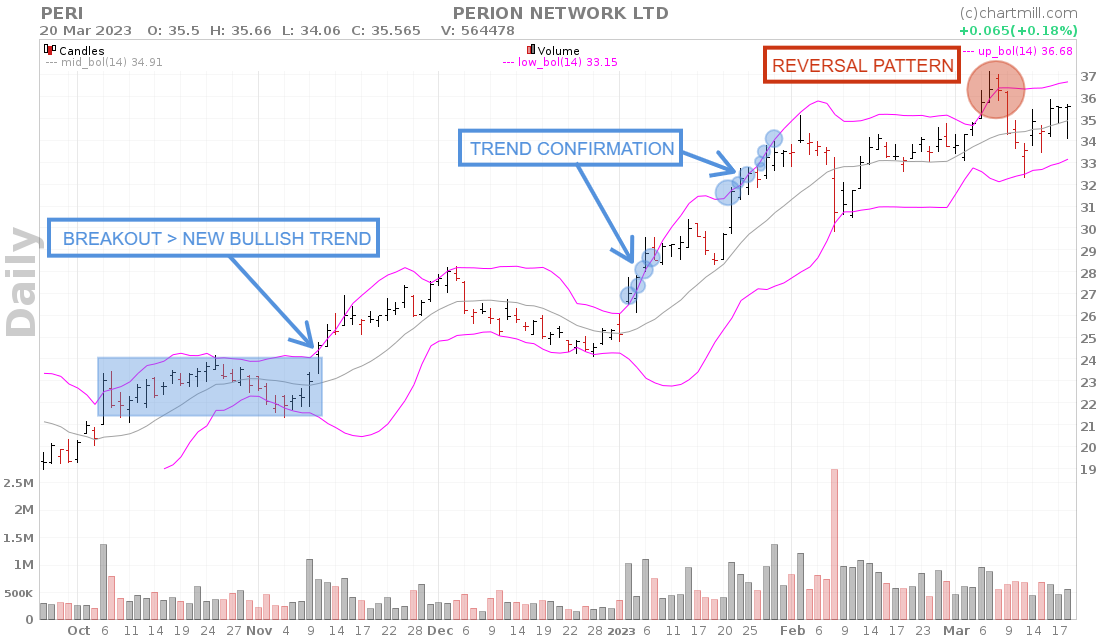
When the price moves sideways in an increasingly narrow range for a while and then suddenly closes above the upper Bollinger band, there is a buy signal. A sell signal occurs when the price suddenly closes below the lower Bollinger band. This is called the Bollinger Band squeeze.
-
as a confirmation signal of an existing strong trend
When the price continues to rise while staying close to the upper Bollinger band it is a confirmation of a strong bullish market. The same price trend in the opposite direction indicates a strong bearish trend.
-
as a reversal signal at the end of an existing trend
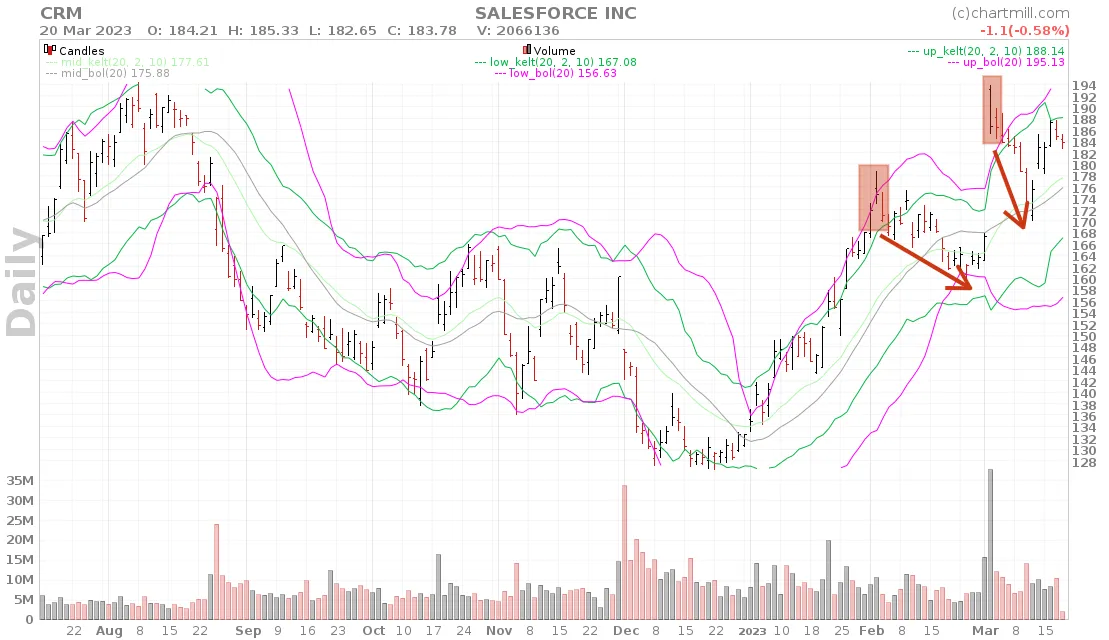
A bearish reversal signal occurs when after a strong bullish trend, the price suddenly drops sharply and a clear reversal pattern becomes visible. At the same time, the price closes significantly lower than the upper Bollinger band.
This is an indication that the existing trend is losing strength and momentum and a trend reversal may be imminent. If you still have open long positions, this is a good time to move your stop loss a bit closer to the price.
A bullish reversal signal is also possible and occurs when an existing strong bearish trend is coming to an end.
Related Video on Bollinger Bands
About Keltner Channels
How It Looks
As is the case with the Bollinger Bands, the Keltner Channels consist of three different lines. The middle line is by default a 20-day exponential moving average line of the price.
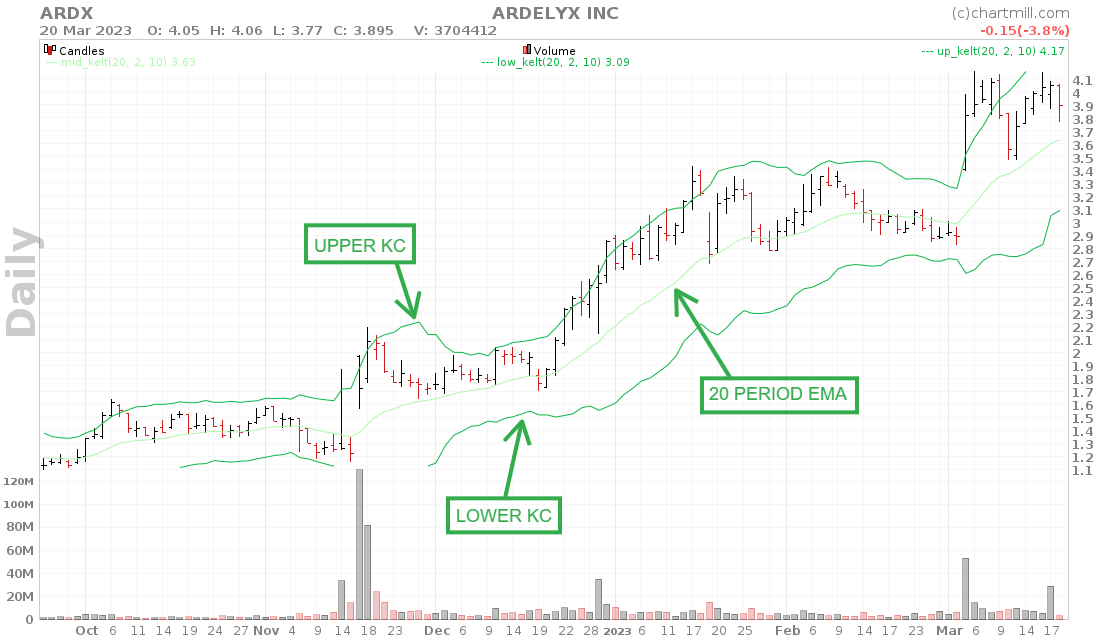
The upper and lower Keltner channels are based on the distance between the highest and lowest prices of the past 20 days, the so-called ‘Average True Range (ATR)’. On these, just as for the middle line, a 20-day exponential moving average line is calculated.
Unlike the Bollinger Bands where a standard deviation is used, the Keltner Channels project the actual width of the price range.
How it is used
In terms of using and interpreting the Keltner Channels, there is no difference from the Bollinger Bands. The indicator can just as easily be used to confirm trends, discover new trends or signal the end of existing trends.
Related Video on Keltner Channels
Bollinger Bands vs Keltner Channels
The difference between the two indicators is reflected in the way volatility is calculated, both for the outer channels and for the centerline.
Calculation of the outer channels
The extent to which price volatility is measured is a key point of difference between the two indicators. For this purpose, Bollinger Bands uses the concept of standard deviation to express how much the price can deviate from its mean.
Keltner Channels similarly measure this volatility but do so in a somewhat more nuanced way. This indicator uses the Average True Range for this purpose which in itself is also an average of the absolute price range.
The difference between the two methods of calculation becomes especially apparent in the case of sudden very significant price changes. Because Keltner Channels use an average instead of the classical standard deviation, the indicator will react less directly to sudden strong price changes. As a result, the movement of the indicator looks a bit smoother, with fewer outliers.
Midline calculation
The way the center line is calculated for both indicators is also different. Keltner Channels do so using an exponential moving average that gives a bit more weight to recent prices. As for Bollinger Bands, a simple moving average is used where the price data in the used period are each given equal weighting.
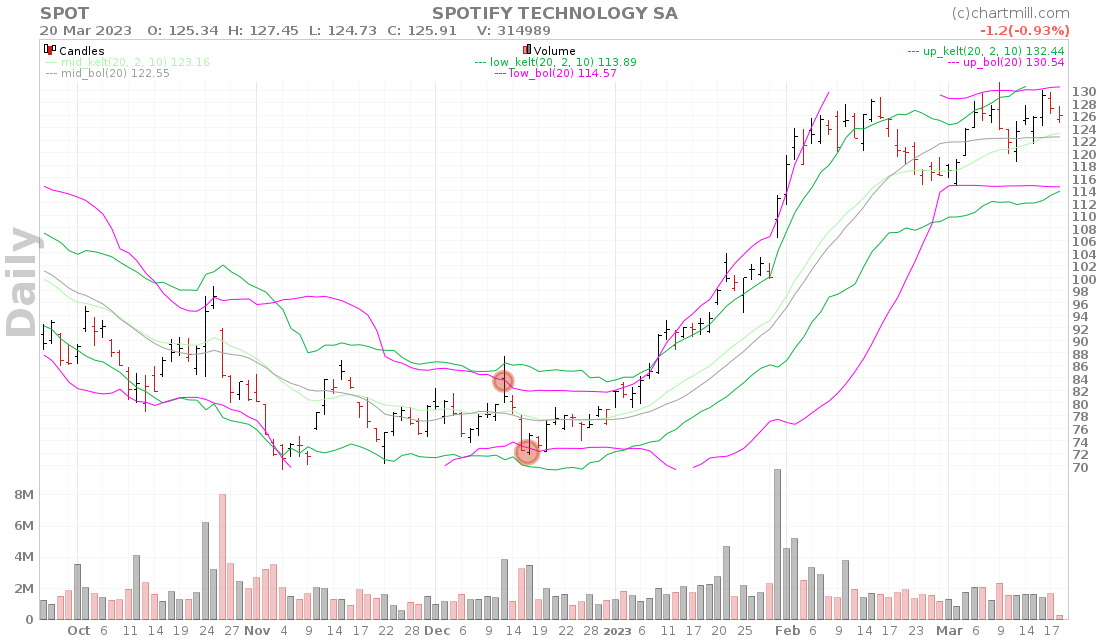
During sudden violent price movements, this will cause the middle line of the Kelter Channels to react a bit more responsively, as seen in the chart below. But the difference is marginal and much less pronounced than in the calculation of the outer bands.
Which Indicator Should You Use?
To state that one indicator is better or more reliable than the other is simply not correct. Although the two indicators have many similarities, they each respond to price changes in their own way because they are calculated differently. Which of the two you want to use depends on two important factors.
- Market volatility (are price movements very pronounced or rather quiet?).
- Your investment style (short-term? or long-term? Trend following? Countertrend?).
Bollinger Bands are more sensitive to market volatility as explained above.
When price volatility suddenly decreases, the extreme bands of the Bollinger Bands will converge faster. In this way, a narrow trend channel emerges more quickly than with the Keltner Channels.
When prices eventually rise or fall again and volatility increases as a result, the price will first break the extreme bands of the Bollinger Bands. So the number of signals is greater with the Bollinger Bands, but the flip side of the coin is that at the same time, the number of false signals increases.
Nevertheless, If your strategy is short-term and you don't want to miss signals, Bollinger Bands are better suited because they react faster to price changes.
Keltner Channels are less sensitive to strong market fluctuations because they also average the outer channels on the middle line (which is itself an average). As a result, the outer channels of these indicators take a little longer to be broken at the start of a new trend.
Consequently, they are more useful for investors with longer investment horizons who have no problem waiting a little longer in exchange for a slightly greater reliability of the buy or sell signal.
However, Keltner Channels are less suitable for signaling a potential trend reversal. This is because a strong trending price can be positioned above its upper channel for a long time.
The extreme channels of the Bollinger Bands rise more quickly due to their specific method of calculation. The price has to be quite strong to maintain a closing price above the upper Bollinger band.
A reversal signal which occurs in a very strong trend and where there was first a close above the upper Bollinger band is therefore more reliable than the same signal with Keltner Channels.
The Squeeze Setup: Best Of Both Worlds?
The Squeeze setup uses both the Bollinger Bands and the Keltner Channels. We already know that the outer bands of both indicators tend to move closer together as soon as volatility decreases. This is because the price trend becomes a lot calmer and a fairly narrow price range forms. In technical jargon, this is called a consolidation zone.
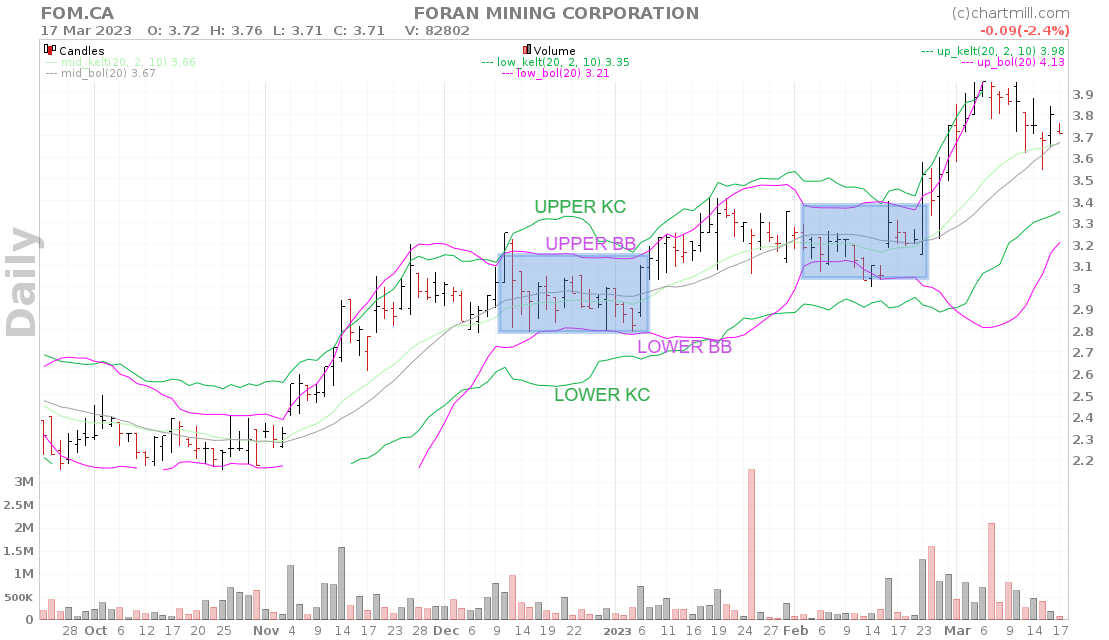
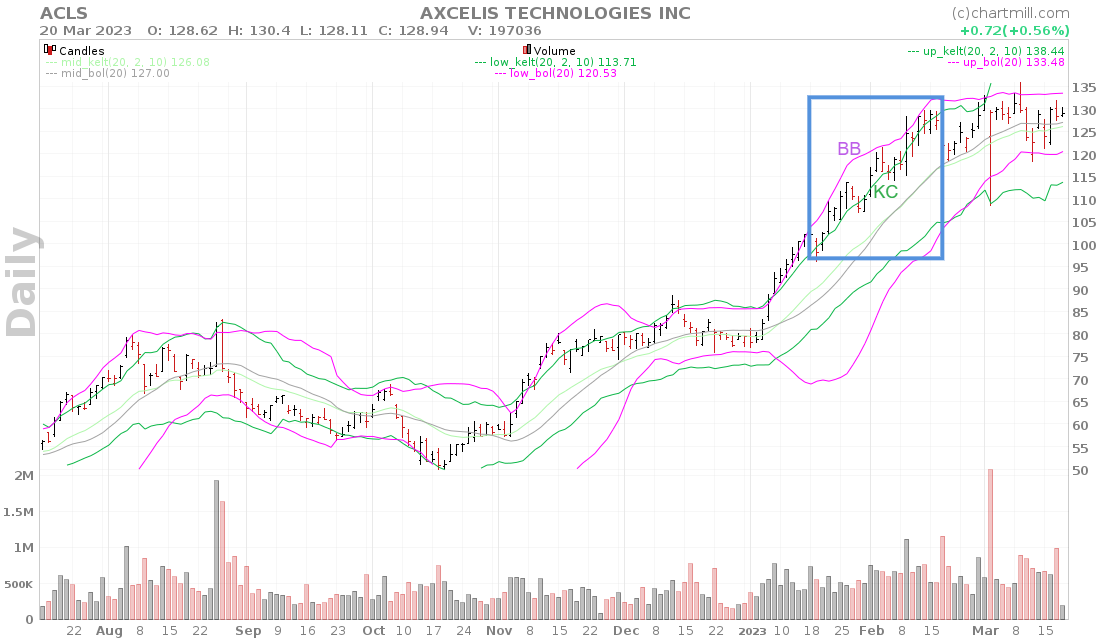
The squeeze occurs as soon as both the upper and lower Bollinger Band are inside the Keltner Channel. To be clear, the upper Bollinger Band must be below the upper Keltner Channel and the lower Bollinger Band must be above the lower Keltner Channel. Only then will there be a true squeeze setup. See the chart below for an example.
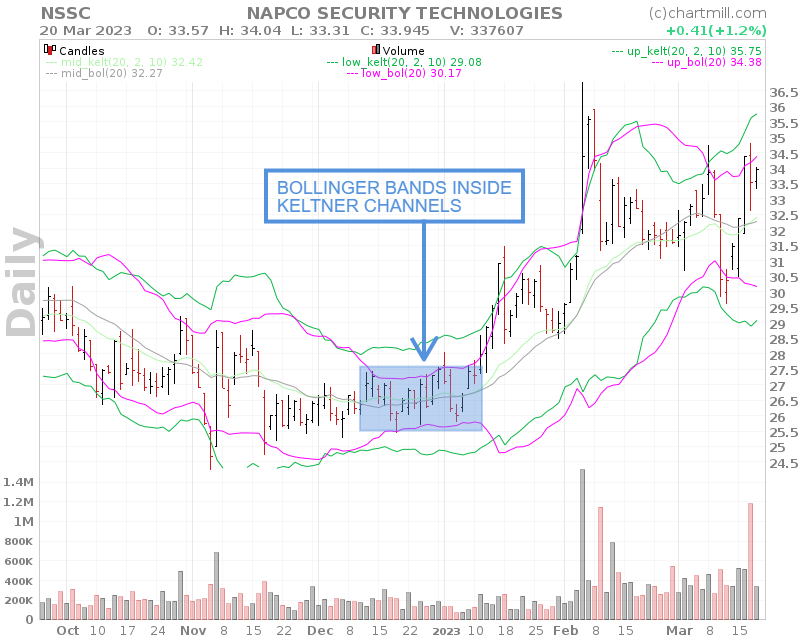
The goal is to find stocks moving sideways within a narrow price range and watch them until they break out at some point.
By using both indicators simultaneously we can consider the first breakout through one of the Bollinger bands as a warning signal and if shortly afterward (or even better, at the same time) the Keltner Channel is also broken that is a confirmation of the move. Combining both indicators has a positive impact on the accuracy of the signals.
Bullish squeeze setup
A bullish squeeze setup occurs as soon as the price breaks out and closes above the upper Bollinger band. This is an indication that volatility is increasing and there is a chance of a strong upward movement with high momentum.
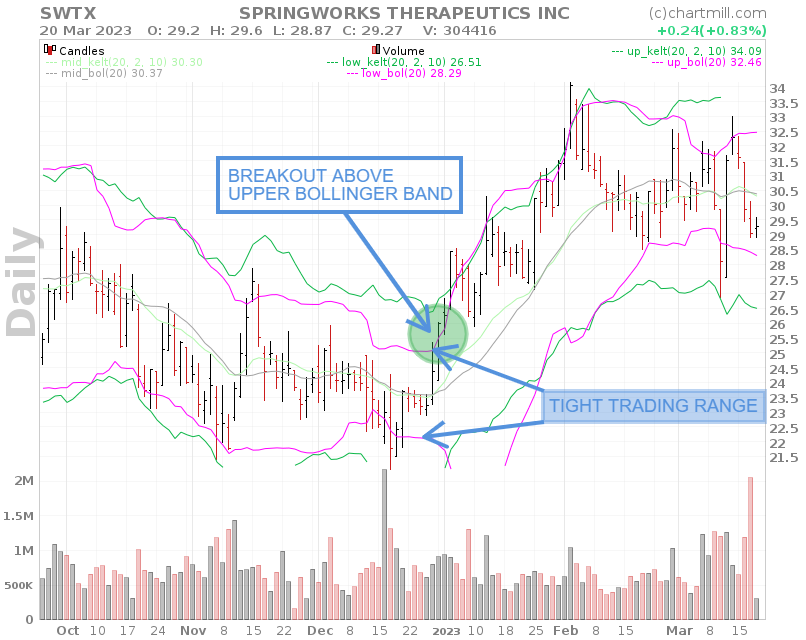
While doing so, also keep an eye on the strength of the move itself and the associated buying volume. Short-term traders, depending on the price performance and associated volume, will open a long position as soon as the price closes above the upper Bollinger band.
In case of a minor breakout and/or if the volume does not increase significantly or is even lower than the previous period, then one can wait until also the upper Keltner channel is broken. In this way, a false signal entry can be easily avoided.
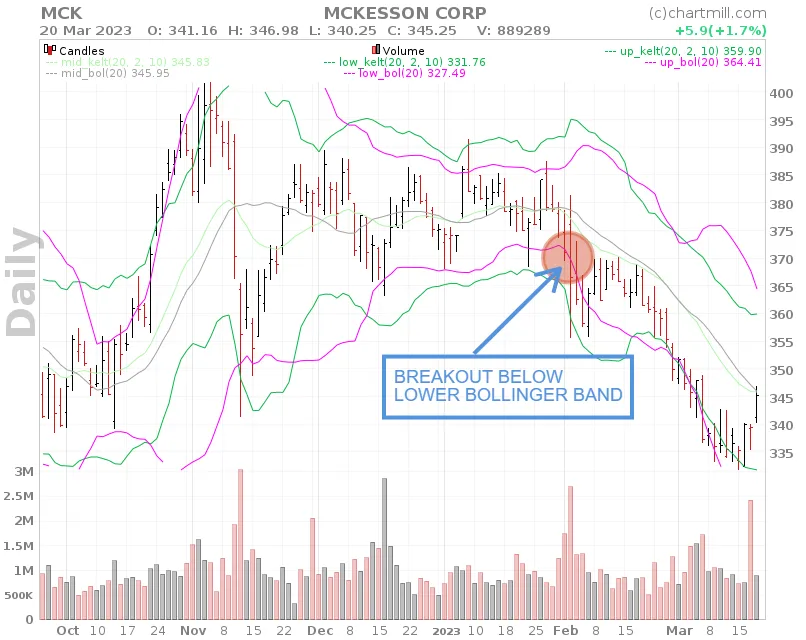
Bearish squeeze setup
A bearish squeeze setup logically forms if the price shows a close below the lower Bollinger bands. There is a chance that further downward movement will follow. The same observations apply to the bullish squeeze setup.
In Summary
Both the Bollinger Bands and the Keltner Channels are popular price channel indicators that provide valuable insights into price trends and momentum. Bollinger Bands are based on a 20-day simple moving average, while Keltner Channels are based on a 20-day exponential moving average (standard values).
Both indicators have three lines: a middle line and upper and lower channels. To calculate those upper and lower channels, Bollinger Bands use a standard deviation on the midline, while Keltner Channels use the actual width as the basis of the price range.
Bollinger Bands, compared to Keltner Channels, are more sensitive to market volatility. Therefore, Bollinger Bands are better for short-term trading, while you are better off using Keltner Channels when trading on longer timeframes.
The Squeeze setup combines both indicators, which tend to move closer together as volatility decreases. The Squeeze occurs when both the upper and lower Bollinger Band are inside the Keltner Channel, indicating a consolidation zone. The Squeeze is an indication of a potential big move, and traders can use this to enter a long trade early as soon as the price breaks out above the upper Bollinger band.
FAQ
What are the best settings for Bollinger Bands?
The middle line is typically a 20-day simple moving average, while for the upper and lower Bollinger Bands 2 standard deviations are used from that middel line.
Other settings commonly used:
- Short term: 10 day moving average, bands at 1.5 standard deviations. (1.5 times the standard dev. +/- the SMA)
- Medium term: 20 day moving average, bands at 2 standard deviations.
- Long term: 50 day moving average, bands at 2.5 standard deviations.
What are the best settings for Keltner Channels?
The exponential moving average (EMA) - the middle line - of a Keltner Channel is typically 20 periods, but this can be adjusted if desired.
The upper and lower bands are set two times the average true range (ATR) above and below the EMA, although the multiplier can also be adjusted based on personal experience.
Which is better, Bollinger Bands or Keltner Channels?
There is no single answer to this because it depends mainly on your personal trading style. An active short-term trader who does not want to miss any potential signal better uses the Bollinger Bands because this indicator reacts faster to price fluctuations.
However, do you want signals that are a bit more reliable and do you have a somewhat longer investment horizon? Then you are better off with Keltner Channels which will give fewer false signals.