Keltner Channels | Trading Strategy (for the Long Term Investor)
Introduction
In our first article you could already read what exactly Keltner Channels are, what they are used for and how they relate to the Bollinger Bands. In this second article we discuss a long-term trend strategy which can be interesting for investors and by extension all those who mainly rely on fundamental analysis but who are looking for a tool which allows them to better time their entry into a specific stock.
Looking for those Long Term Trends...
Anyone who invests for the long term logically intends to hold positions for as long as possible. Consequently, usually little attention is paid to the exact entry point. Nevertheless, Keltner Channels are an excellent tool for determining an entry point in an objective and at the same time simple manner.
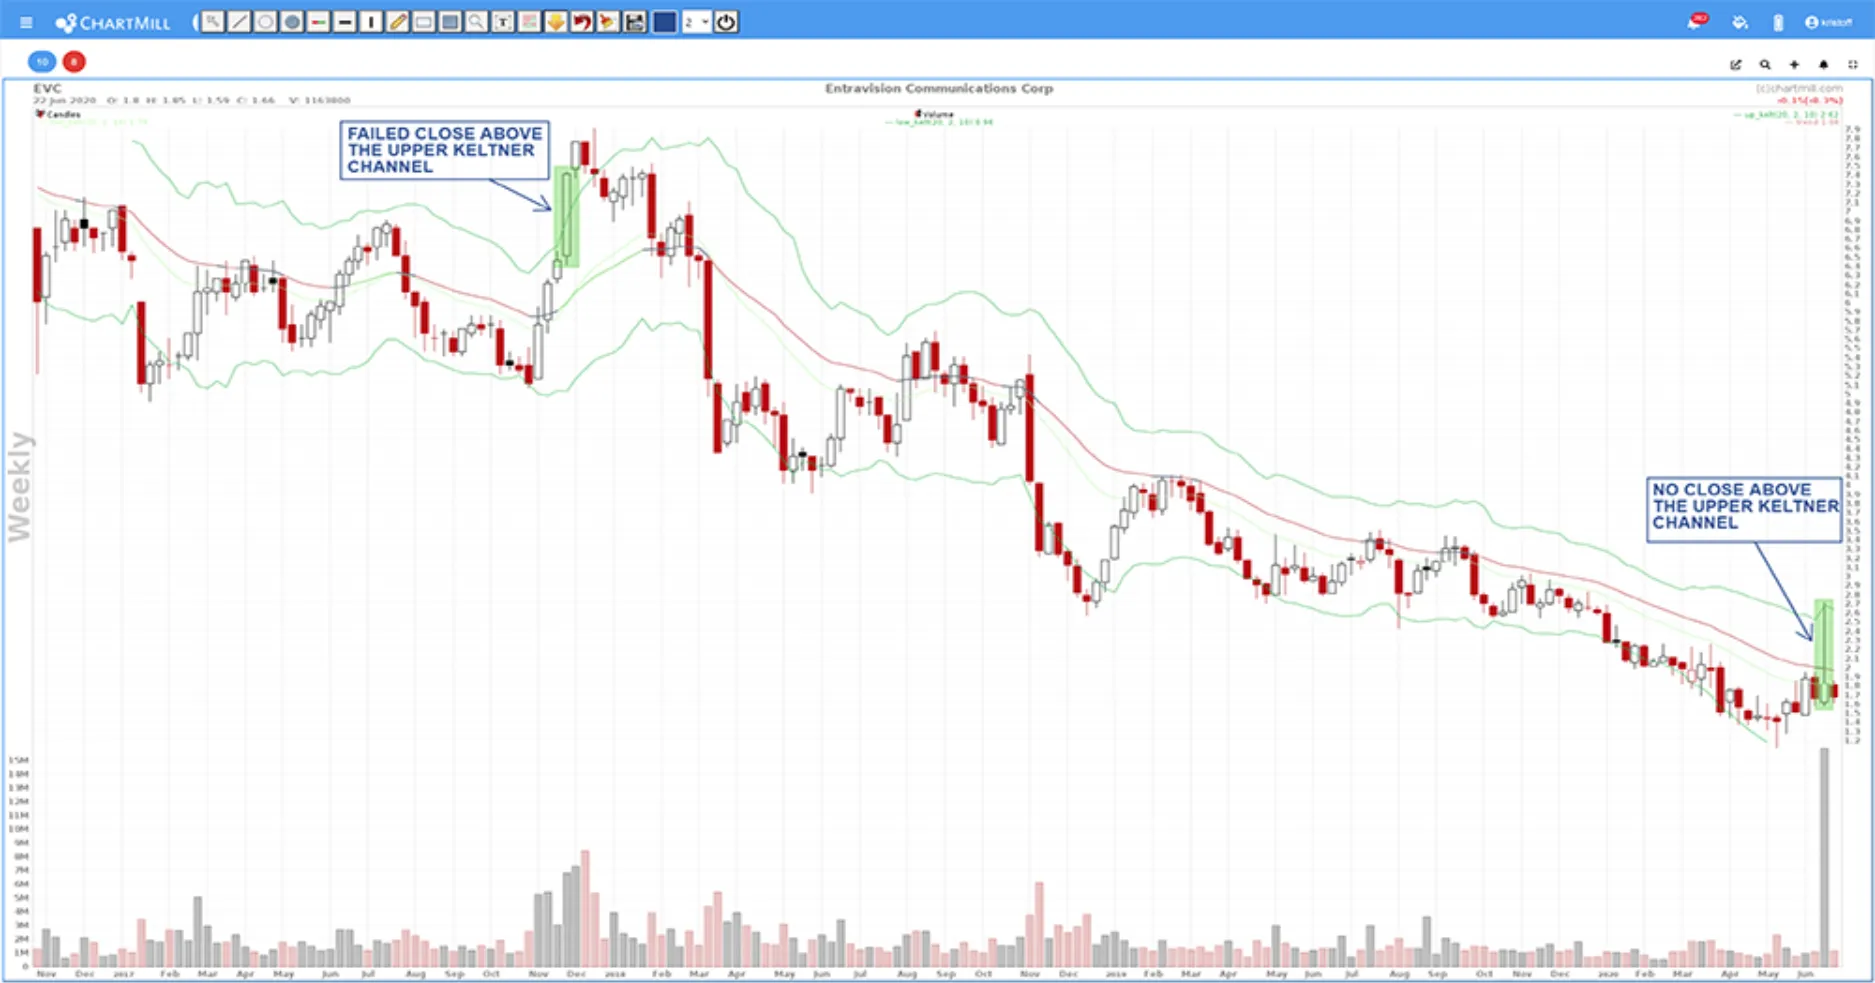
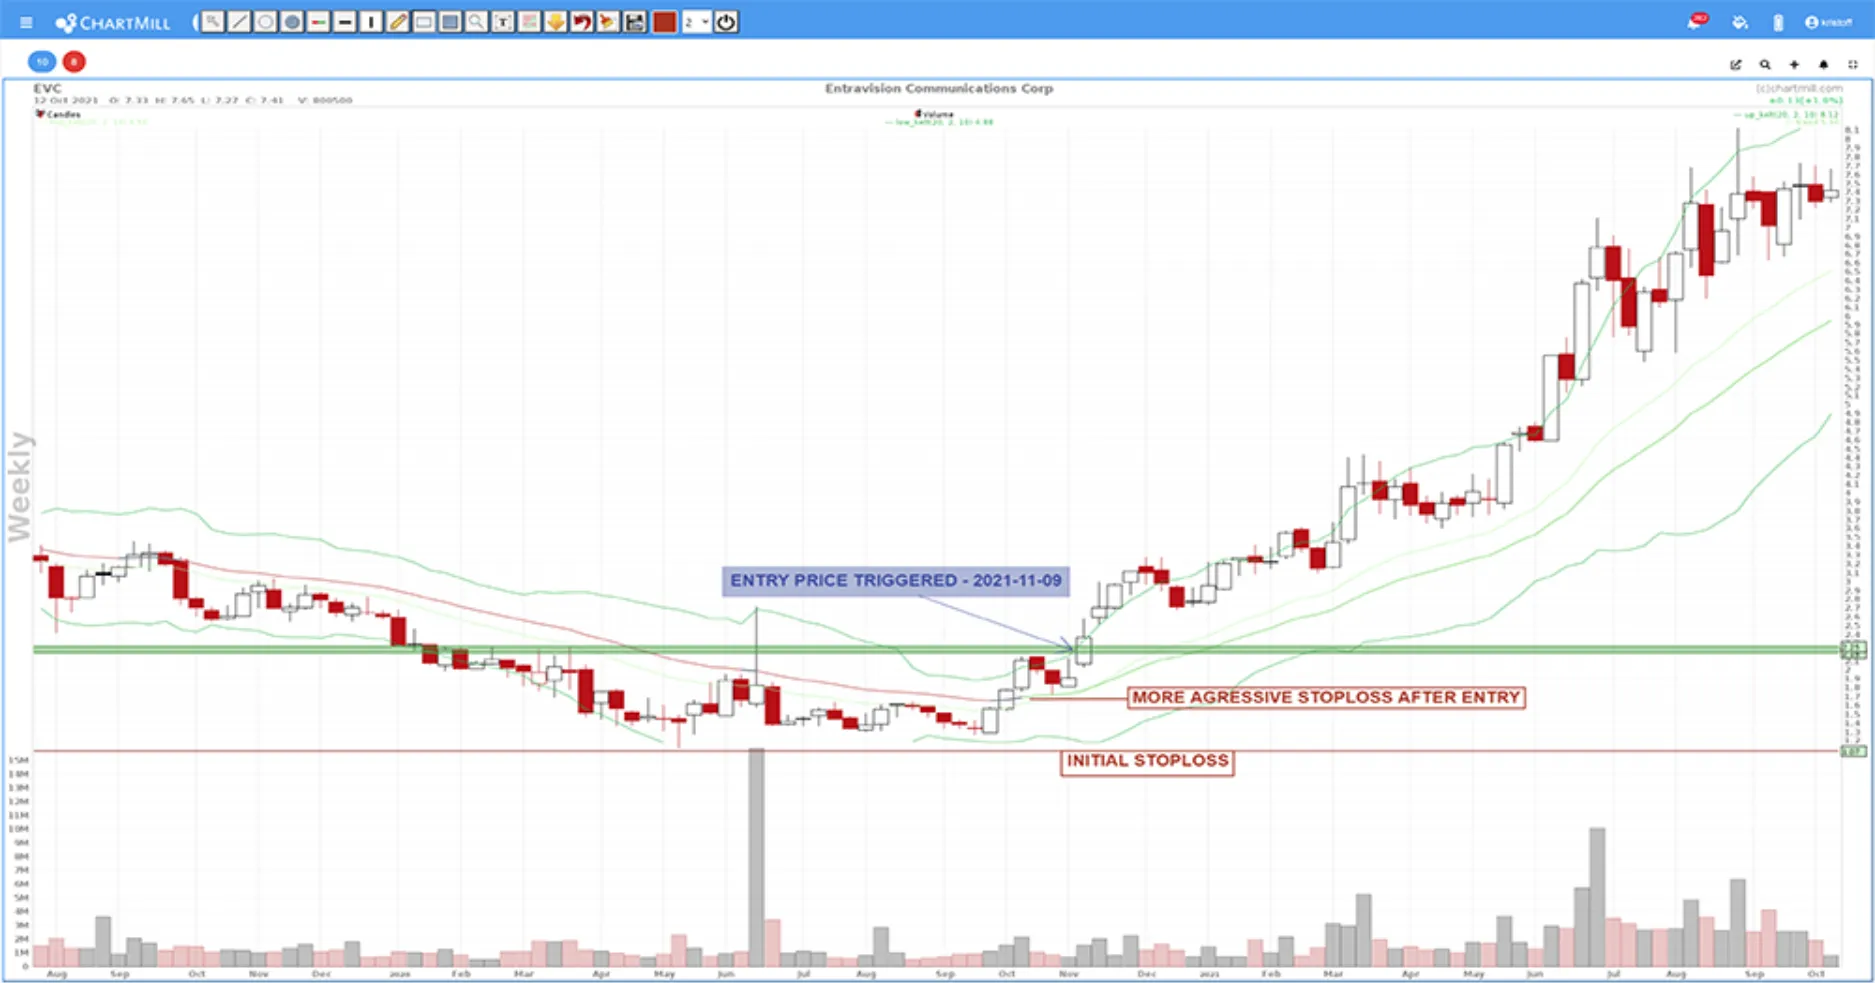
Below is the price chart of Entravision Communications corp shown on a weekly basis. We assume in this example that you, as a long-term investor, have been following the company for some time and that you believe the stock is absolutely worthy of purchase at current prices which have fallen significantly since the end of 2017. The green lines below and above the price represent the upper and lower limits which form the Keltner channel. The chart clearly shows that since the last high around $9.5 - which already dates back to the end of 2015 - price has managed to break through the upper Keltner channel only once, this was at the end of 2017. However, that breakthrough was not exactly a success, the price fell back just as quickly and the downward trend resumed.
Another shaky attempt is seen at the end of the chart, where the price briefly flirted with the upper boundary of the Keltner channel intraweek but where the bullish sentiment was completely negated by the end of the trading week, causing the price to fall back into its known trading range. However, there was one fact that you absolutely could not ignore as an investor. The upward movement - even if it was only temporary - was accompanied by an enormous increase in buyer volume. We have already addressed this in many other articles but we will do it again here, volume is and will always be one of the most important parameters in evaluating price movements. Furthermore, we observe that the existing low has not been broken so at the time there was more evidence of a sideways movement.
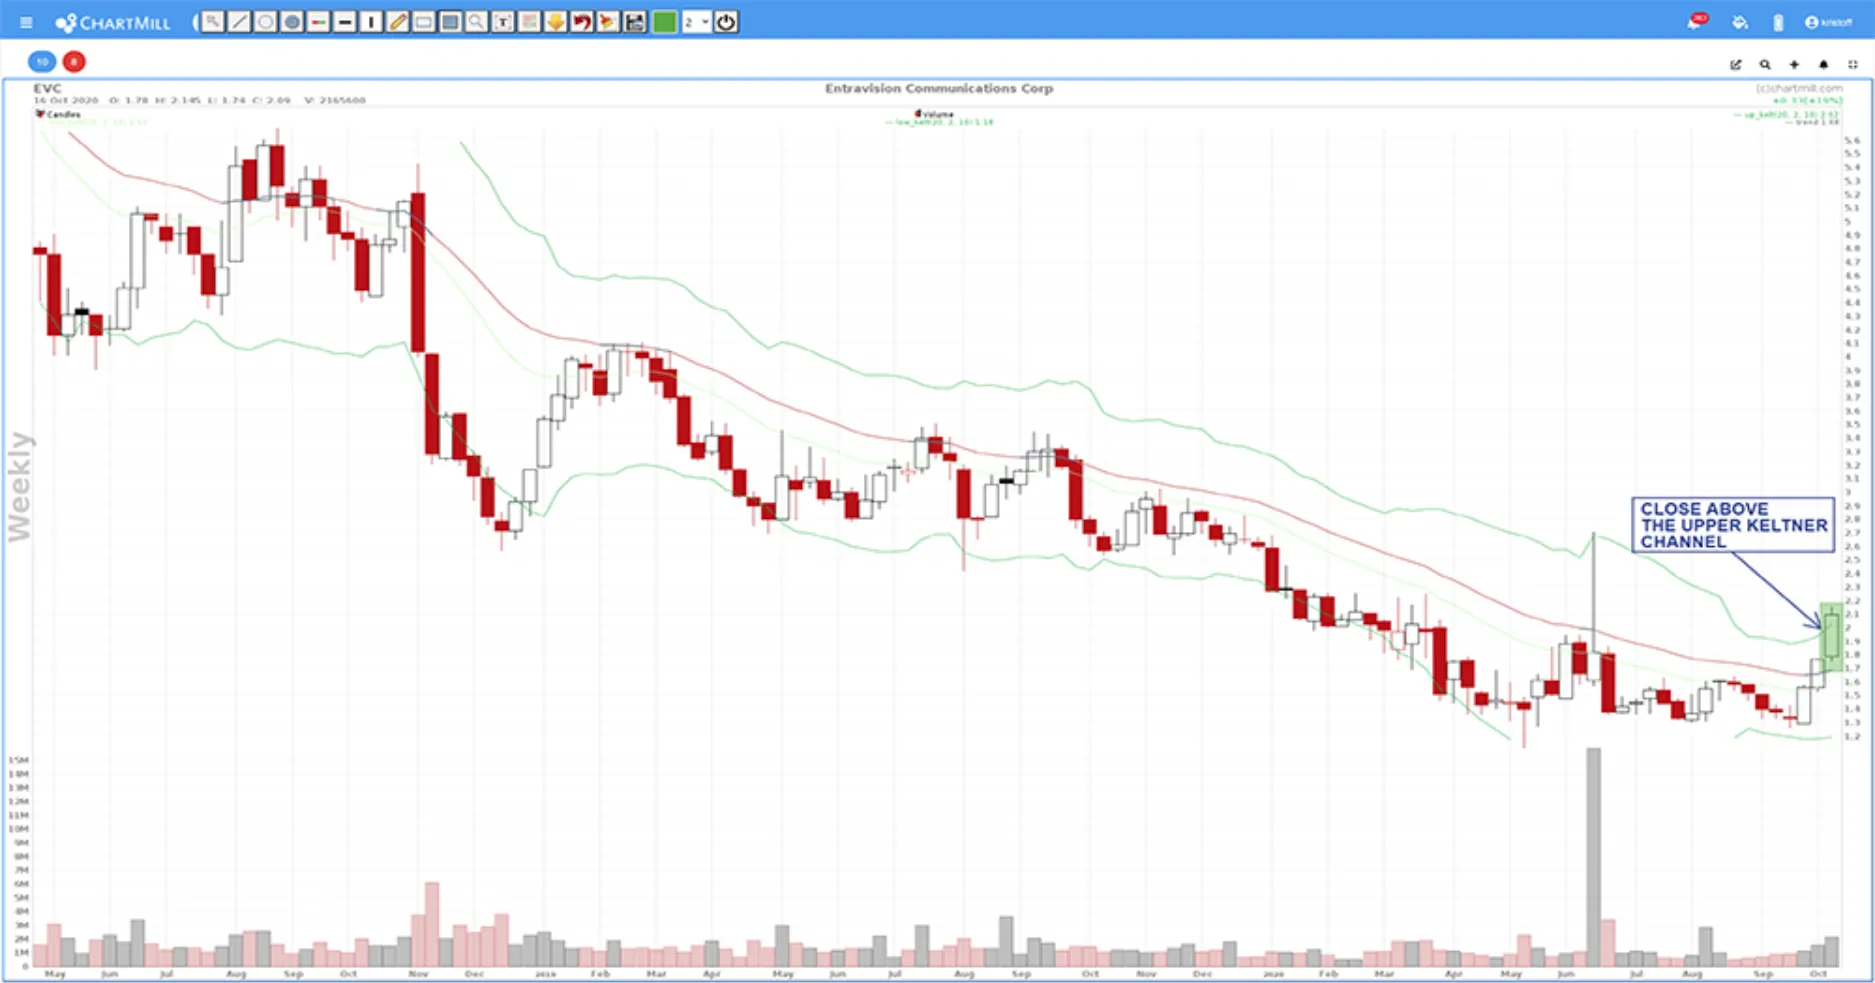
 On October 12, 2020, it finally happened, the price closed above the upper Keltner band. That signal provides the trigger on which you could act as an investor.
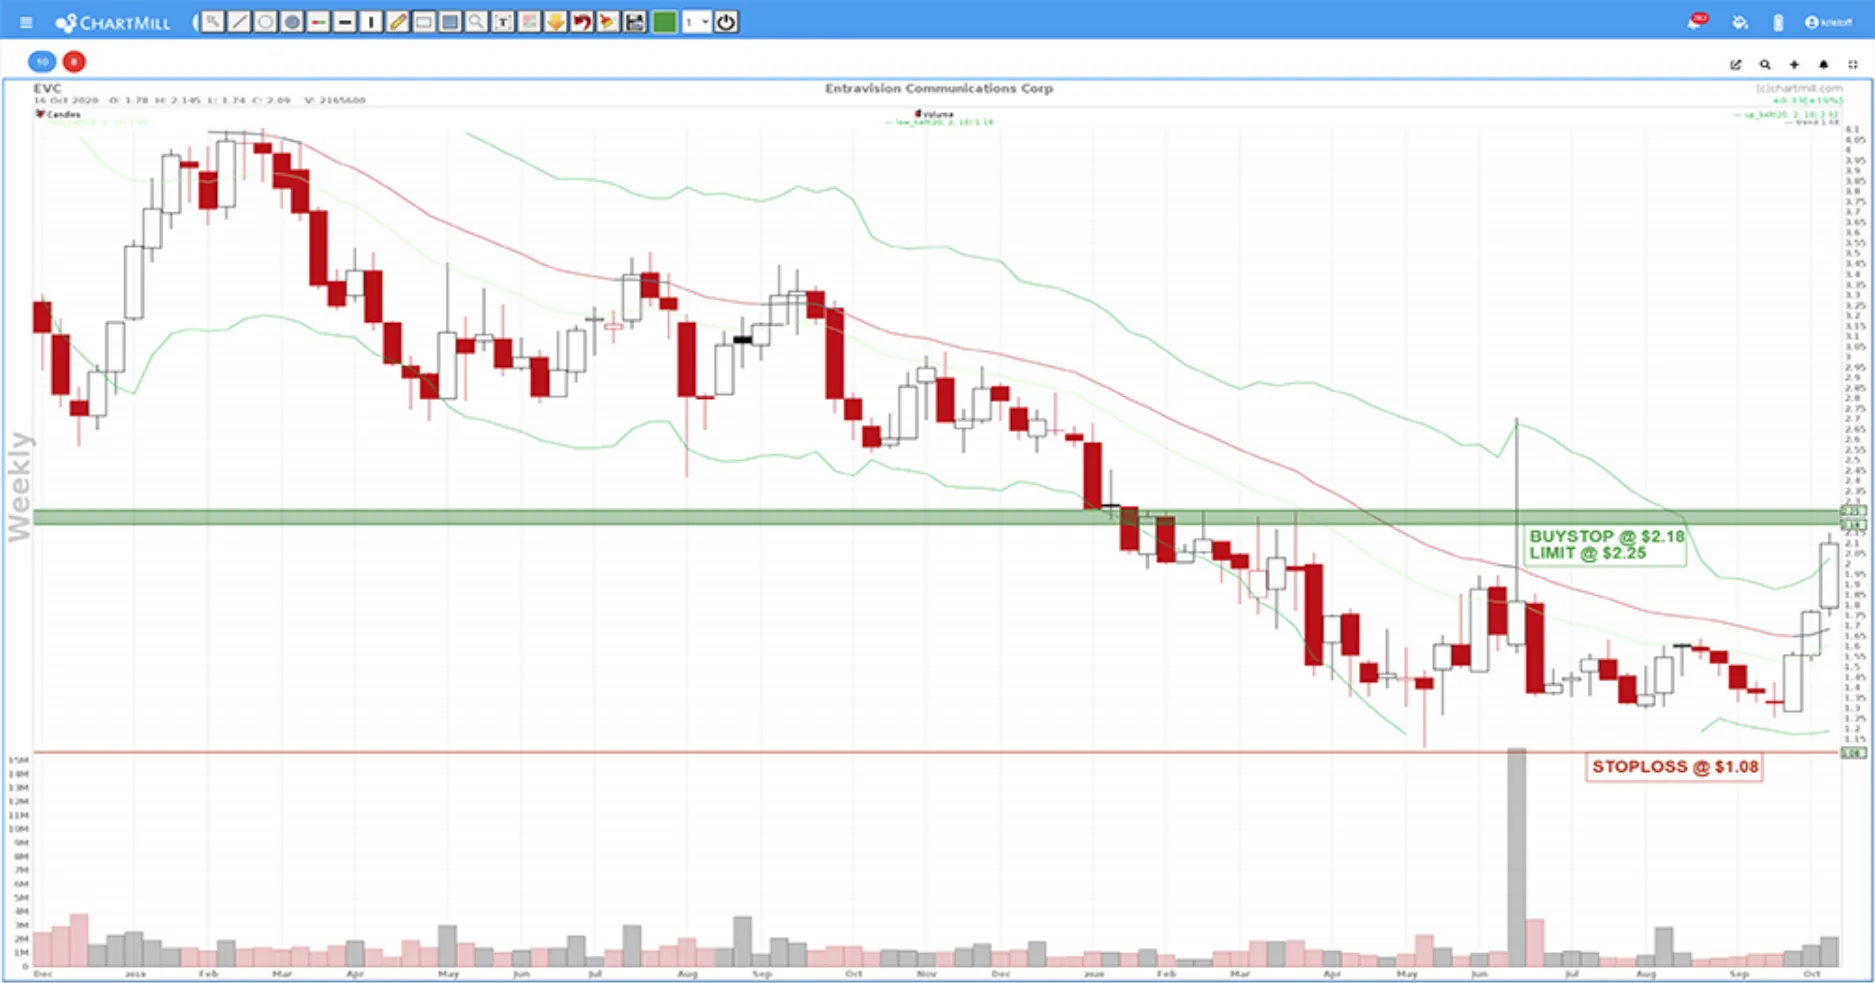
To enter the market a Buy Stop Limit order is the best choice. Such an order has to be available by default in any trading platform worthy of the name. The 'Buy Stop' is placed just above the highest price of the break-out candle ($2.18), in this way we will have confirmation that the previous week's high ($2.14) will be taken out before the order becomes active. The Limit order ($2.25) linked to it protects us in case the price opens unexpectedly much higher (gap up). Suppose for example that the stock price opens at $3, with a normal order at market price the shares will be bought at the prevailing market price, which will be around $3. Therefore, in this example we set the buy limit at $2.25. Using a limit price also has a small disadvantage though… Even if the price opens only 1 cent above your limit and immediately continues to rise sharply, your order will not be filled. So take this into account and don't set your limits too sharply. In this case we have positioned the stoploss very well below the lowest price applicable at the time. But also in the area around $1.5 would have been a valid option.
 The rest of the price movement after the entry is shown below:
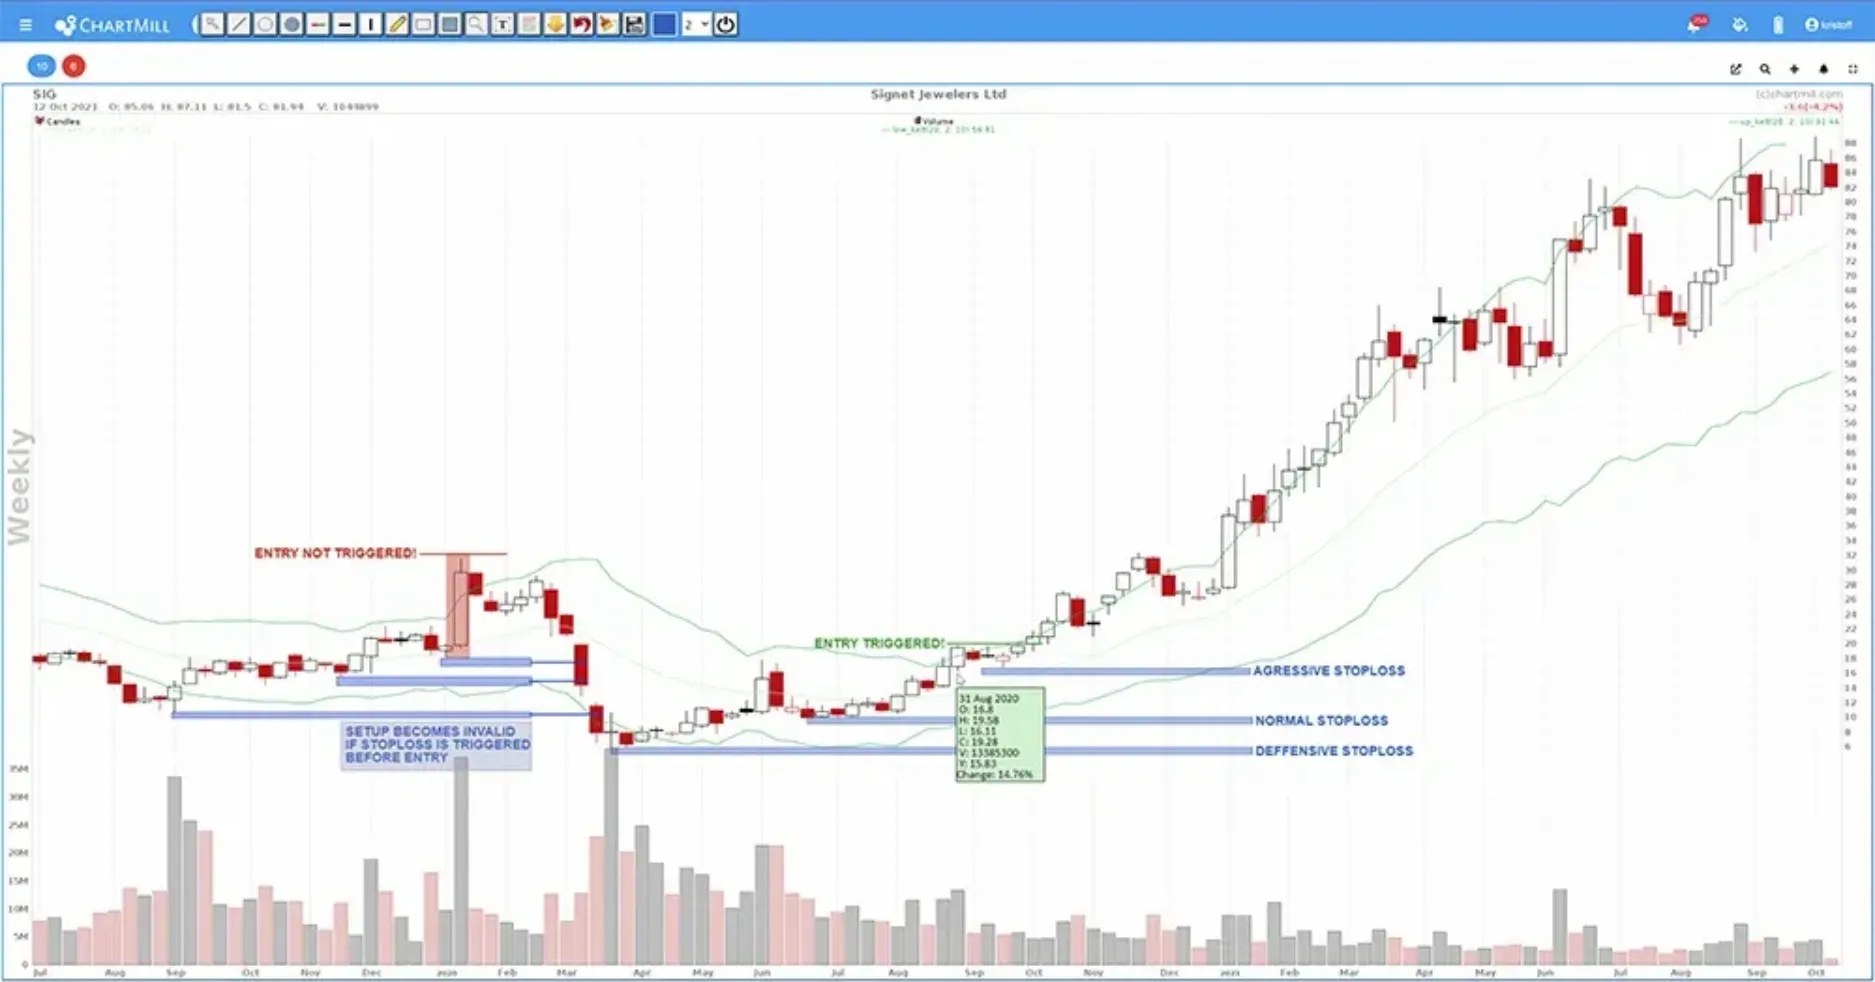
Another example in the chart below. Price broke out above the upper Keltner channel twice. The first time however, the Buy Stop Entry was not met and the price fell back to the stoploss level which automatically cancelled the setup. The second time was successful with a significant price increase as a result.
A final example where the first position was stopped out. However, the second entry was a successful one.
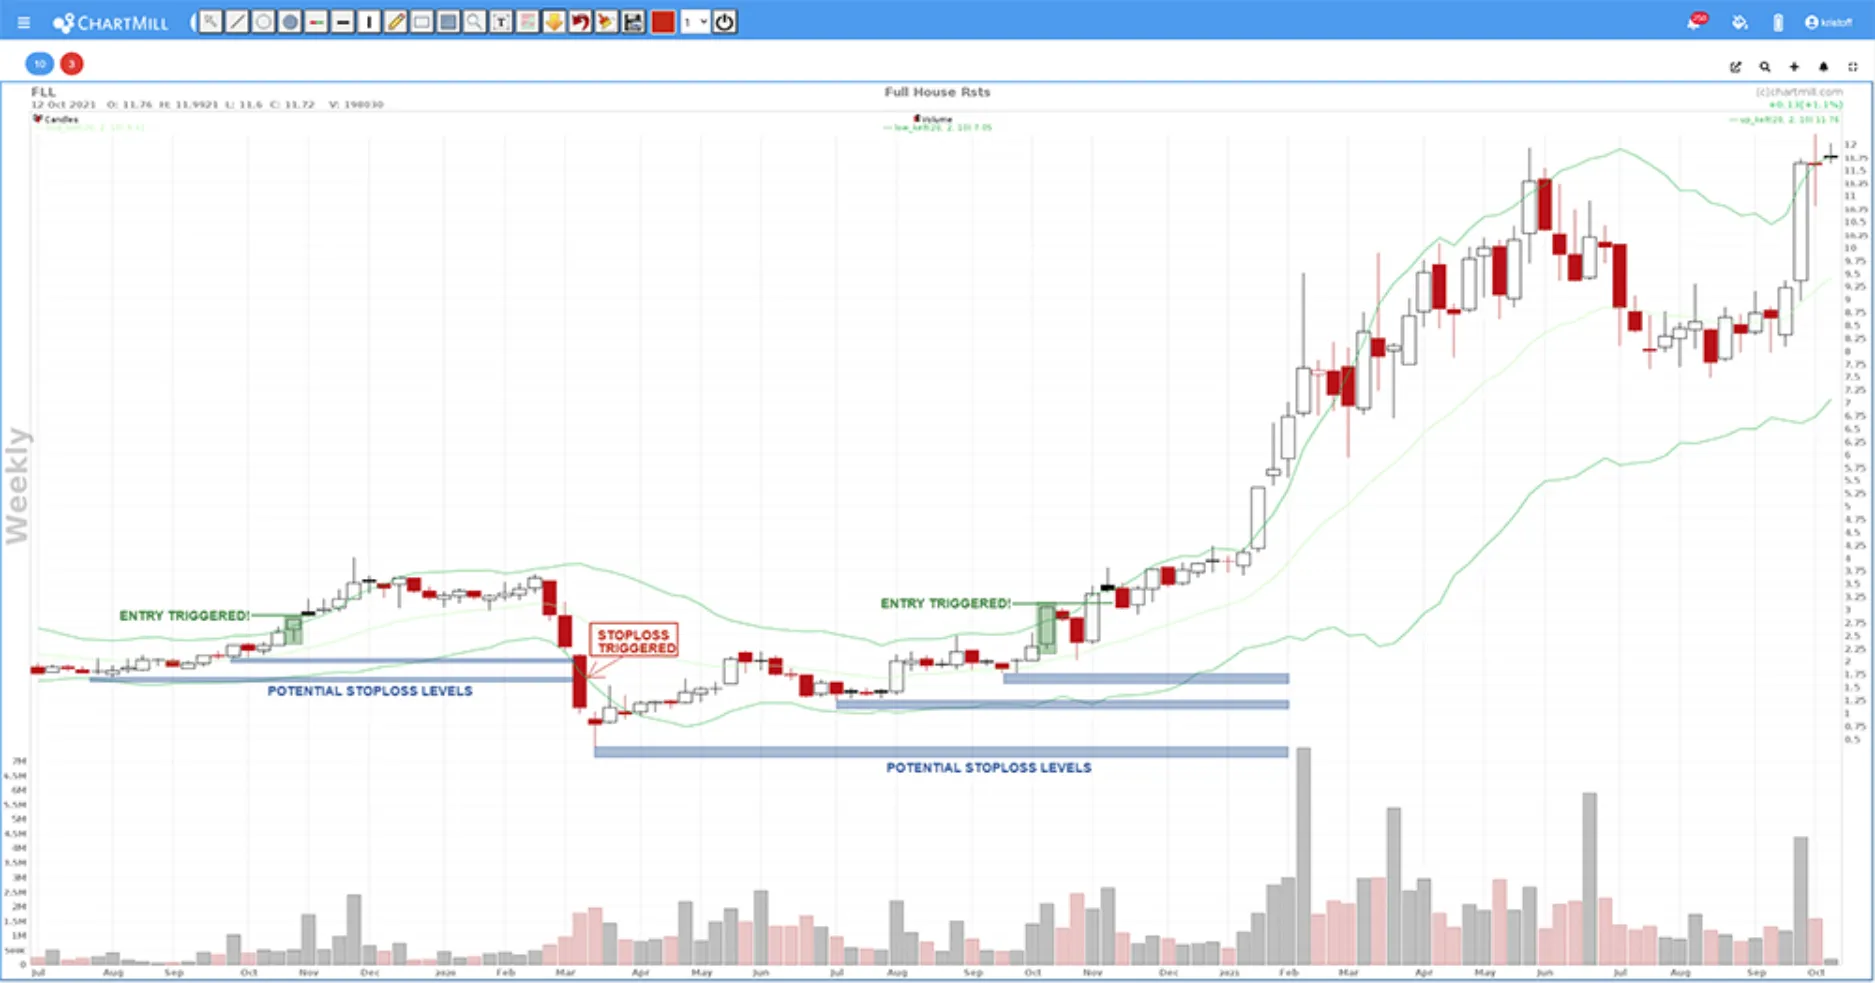
Conclusion
As with all strategies, this one will sometimes succeed and sometimes fail, as shown in the last example. However with successful entries the potential profit is many times bigger than what you lose if the stoploss is triggered. So even if you are only successful in half of the cases, the final profit will be a lot larger than the total loss. The only necessary condition, however, is that you allow the winners to run as long as possible.