
TRADERS - Tsunami Setups
Published on Chartmill with kind permission of TRADERS’ Magazine. Check the original PDF article here
Setups. They’re the bread and butter of every technical analyst. And they really come in thousands of flavors, even though there are only a few types of them. In this article we’re going to shed a light on how breakouts, one type of setups, can at least in one way be successfully handled.
When we trade, we chase profits. Profit always comes from a difference in price between the moment we buy and the moment we sell, though not necessarily in that order. That way, only price pays. And it’s price that we should watch most closely of all, when we trade. Depending on our strategy of choice, we try to buy bottoms, sell tops, buy weakness, sell strength, get in on counter trend moves or on breakouts. And it’s breakouts we’re going to handle in this article.
Breakout strategies
The basic premise behind trading breakouts, is to get on board of a trend the moment it starts, ‘moment’ being the keyword here. This kind of trading also gets referenced to as ‘momentum trading’, basically assuming that momentum feeds on itself as buying begets buying and selling draws in more sellers.
Apart from the fact that it’s a logical sound idea that moving prices will draw attention, given de abundance in monitoring tools we have at our disposal today and the fact that human behavior doesn’t change. The idea is also conceptual plausible due to the theory of viral/exponential spreading of ideas. Not only is trading breakouts based on simple logic, there’s also strong empirical evidence for it. Evidence that springs both from the historical market data side, as well as from behavioral finance scientists.
To begin with, there are quite some studies that correlate the performance of financial series to the series’ previous performance, giving merit to the idea of momentum indeed existing in financial markets. This might, in effect, be somewhat the equivalence of Newton’s first law of motion, calling inertia the tendency of something in rest/motion to stay in rest/motion until some external force start changing its motional state. The forces here mainly being money and people investing or withdrawing it. All of those studies basically state that something that performs well/bad, keeps doing more of the same for some time. What’s more there seems to be a clear link between the duration of a trend and the probability it keeps going. Don’t get me wrong, it’s not that trends get in some ‘perpetual mobile’ state. But studies show that the best performing assets for the previous 3 weeks have a higher probability of also being the ones going to top the performance charts for the next three weeks. But the same seems to hold for 6 weeks, 3 months, and lots of other timeframes.
But there’s also quite some evidence associating volatility, and especially the lack of it, with breakouts. The metaphor I like to use here is that of a tsunami. Just before a tsunami hits a shore, the ocean seems to retract. Translated to volatility this means that after volatility shrinks, there’s a higher probability that it will start swinging off the charts. The longer volatility is (very) low, the wilder and longer the ensuing breakout might be. This does not, however, seems to hold true the other way around. Breakouts don’t necessarily have to be preceded by a volatility retraction.
One example of such research, done by Connors Research, calculated that 74.5% of stocks with a 100 day averaged volatility less than 20% of the stock price, rose within the next 252 days. Of course this is only one of many research examples we could give here.
When you think about this, shrinking volatility clearly is linked somehow to some state of ‘rest’. It’s also not unusual for decreasing volatility to come with lower volumes, although one has to keep in mind the relation between volume and prices. Lower prices mean that people spending the same quantity of money will need higher volumes to satisfy their demand. So a stock going $10, but coming from as high as $80, might easily have low volatility when basing without showing lower (and possibly even higher) volumes. Very often low volatility eventually synchronizes with low liquidity, which then might cause sharp trend reversals, once traders start stampeding on one side.
No thing’s perfect
So breakouts are notoriously popular for lots of traders. In fact it’s easy to see that breakout strategies go hand in hand with trend following strategies. After all, if one wants to catch a trend, one has to catch a breakout eventually. It’s not to say that breakout strategies need to imply trend following on a longer timeframe. But any kind of trend following implies some sort of breakout entry strategy.
Breakouts, how sound they may seem conceptually, require a strong stomach or at least a mental persistence to overcome their disadvantages. Breakout strategies are known for their low reliability, resulting from a high number of false positives, conveniently addressed as false breakouts. By some traders and authors this is also recognized to lead to overtrading. There is however a difference between overtrading and sticking only a tow in the water on each breakout. Either way, this than leads to possible lots of very small losses, which only need to be seen as the cost side of trend following strategies. As soon as one finds him/herself in a trend, pyramiding will take care of the rest. However it’s possible to go for less breakouts signals without further lowering the reliability, lowering the overall cost of false breakouts. I discussed an example of a trend following strategy with its own breakout setup in the previous (December) issue of this magazine.
Here I’m going to focus on a breakout strategy without regards to any eventual trend that might follow or how to handle it subsequently. A breakout setup resulting in fewer signals, for traders wanting to watch over our common tendency to overtrade. Chasing the illusion of control, traders have zoomed in on charts and shortened their timeframes and created a demand driven supply of real-time quotes and news. This breakout play can be used successfully in most timeframes. But remember there’s almost a new world out there for traders who relearn to zoom out.
Range contraction and expansion
To cope with subjective interpretations one needs to look to technical indicators, rather than chart patterns. One very popular way to detect decreasing volatility is the concept of inside periods. An inside period is one where high and low are set within (one of) the previous period’s high and low. If however the next period’s activity (let’s call it period 3) is within the extremes of the first period, we call it an inside period to period 1, without it having to be an inside period to period 2. Inside periods, however don’t cope well with shrinking volatility while trending. As a result they can be helpful in detecting base outbreaks but they tend to leave us standing in the cold when it comes to trend reversals.
Al lot of work into this kind of patterns was done by Alan Farley, Toby Crabel and Clive M. Corcoran, resulting in what is called the NR7 signal. A pattern from Crabel adapted by Farley who compared it to a coiled spring. According to these authors, inside periods are one the most reliable forecasting patterns to occur in the marketplace. The precedent condition of narrow range or inside range patterns, so they conclude, are precursors to trend reversals or breakouts.
The NR7 stands for Narrow Range 7, indicating any 7th period having the narrowest range of the past seven periods. In the chart of figure 1 you can see two NR7 signals preceding a trend reversal. If an NR7 signal immediately follows another one this rings a louder bell as odds increase for an immediate breakout event. The second NR7 signal is than called an NR7-2. The same ‘smallest in the past 7 periods’ exercise can be made on volatility, by looking at the ATR for instance. That way an NATR7 is set when the lowest ATR value is registered over de last seven periods. The first NR7 signal in figure 1 also happens to be an NATR7 signal. If you are not familiar with NRx signals, you should definitely look into them, even isolated from this article.
To play these setups, one can put in two bracketed orders (meaning the filling of one automatically cancels the other). This would implicate, on any of the above signals, putting a conditional short entry order just below the low of the last period (by definition the narrowest ranged one of the last seven) while, at the same time, putting a corresponding long entry order just above the high of the last period. The one getting filled first should indicate the direction of the ensuing trend. The other can be cancelled automatically or function as a trailing stop to the initiated position.
The technicals
Although the NR7 family of signals seem to do a good job in their own right, they work even better when volatility on an larger scale also drops. For monitoring this, we use two volatility measures. First we have the famous Bollinger Bands, who basically take two standard deviations of prices from the past 20 periods on either side of the average over the same period. Please note that we disagree with Bollinger on using normal distribution statistics on data that isn’t normally distributed (but rather Taleb distributed). Nevertheless, they do a great job in showing range contraction an expansion. And that’s what we’re using them for here. As our second ingredient we take Keltner channels who try to do the same thing but with a number of ATR’s (we take the factor 2, but 1.5 seems to do it as well) set off from an exponential moving average over 20 periods.
Now, Bollinger Bands will more closely follow price compression and expansion than Keltner Channels will do. This is mainly because of the fact that Bollinger Bands measure price dispersion while Keltner Channels are based upon range. To put this another way, ATR may go down while Bollinger Bands are expanding because of all those narrower periods are still putting up a nice trend. So we want to incorporate both non-trending as well as shrinking volatility into this setup. The setup gets armed whenever Bollinger Bands get between the Keltner Channels on both sides. An example of this can be seen in figure 2, which shows a multi-year monthly chart of Lennar Corporation (LEN). Notice the fact that an NR7 took place the day before the setup got armed (shown by means of the black lined rectangles). On this play we followed the stock downwards with a trailing entry (buy) stop, also shown on the chart with a black stair cased line. The whole process, however, took almost 5 months. But the catch was worth the wait, getting us in a yearlong trend at a very nice price, almost tripling our stock’s value. We can’t stress the fact enough that, even though your zooming in to fine tune the exit of a position, it’s very useful to keep an eye on the timeframe you used to open the position in the first place. Or if you exit on lower time frames, which is perfectly all right to preserve more of one’s profit, always go back to the timeframe on which you decided to enter and start stalking the stock anew. Traders all too often change stocks once they are thrown out. Don’t do that if you’ve just been thrown out of a stock that’s been good to you. This doesn’t mean you have to get right in when you are stopped out. Just start stalking the stock for a possible new entry (perhaps even with a trailing entry stop).
Story Stocks
Finally, a last word on how widespread this type of setup can be played. One area where this setup can come quite in handy is while playing story stocks (or rocket stocks as O’Neil’s disciples tend to call them). These are stocks that have no fundamentals whatsoever. There’s just a nice story, a promise to make it big and a bunch of ifs and whens.
One very nice specimen is Hemisperx Biopharma (HEB), a stock I already played successfully for many years, of course with large intervals of inactivity in between. Stocks like this can hibernate for months or even years in a row. But once they awake then can get very explosive. In figure 3, this stock shows five NR7 signals while it’s Bollinger Bands had fallen between its Keltner Channels. Each time guaranteeing a nice jump and finally blowing off top by almost tripling after the last signal. I’ll leave further study of this type of stock to the willing trader but also want to warn up front to put tight stops and get out very quickly when a trend finally stalls.
One last additional indication of very high probability plays is when they are accompanied by a volume spike alert. Just before volatility retracts there’s an unexplainable large volume on one day or a few scattered days. No news seems to be out or pending and price doesn’t seem to move in accordance with the high volume (we talk 10 to 15 times the average volume here). This is very often a sign of insiders anticipating something that is not yet known to the general public. Feast your eyes on the chart in figure 4 for a nice example of what volatility (and liquidity) imbalance can cause. With this type of stocks, decreasing volatility almost always implies decreased liquidity, which is the fuel we want for a volatility breakout to ignite. So better get started looking for those NR7’s and watch those Bollinger Bands and Keltner Channels. Good luck!
[FIGURE 1]
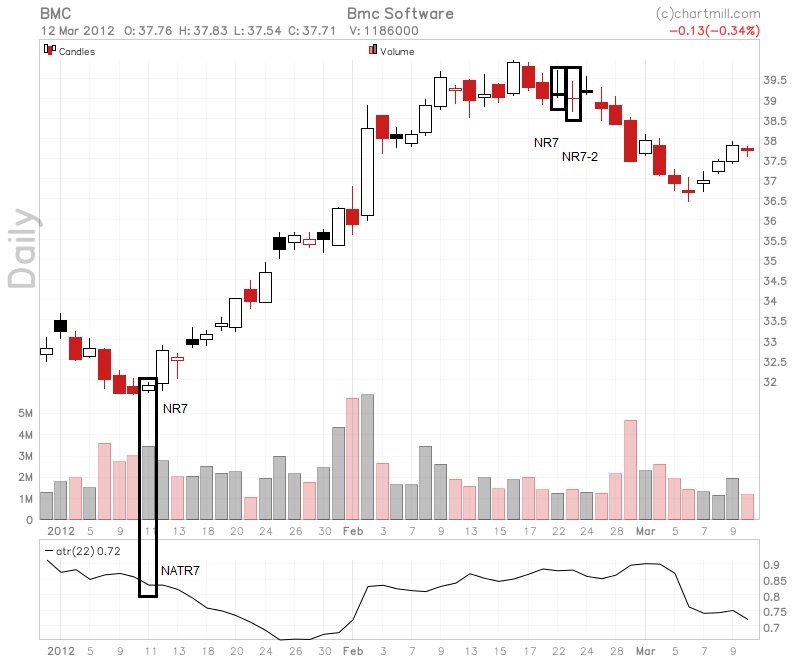
[HEADER] NR7 signals and their cousins
[CAPTION] Figure 1: On this chart we can see a trend reversal initiated by an NR7 signals which also happens to coincide with a NATR7 signal, giving more weight to both of them. At the end of the ensuing trend we have a NR7-2 signal immediately following another NR7 signal. This, again, puts more importance on both signals.
[FIGURE 2]
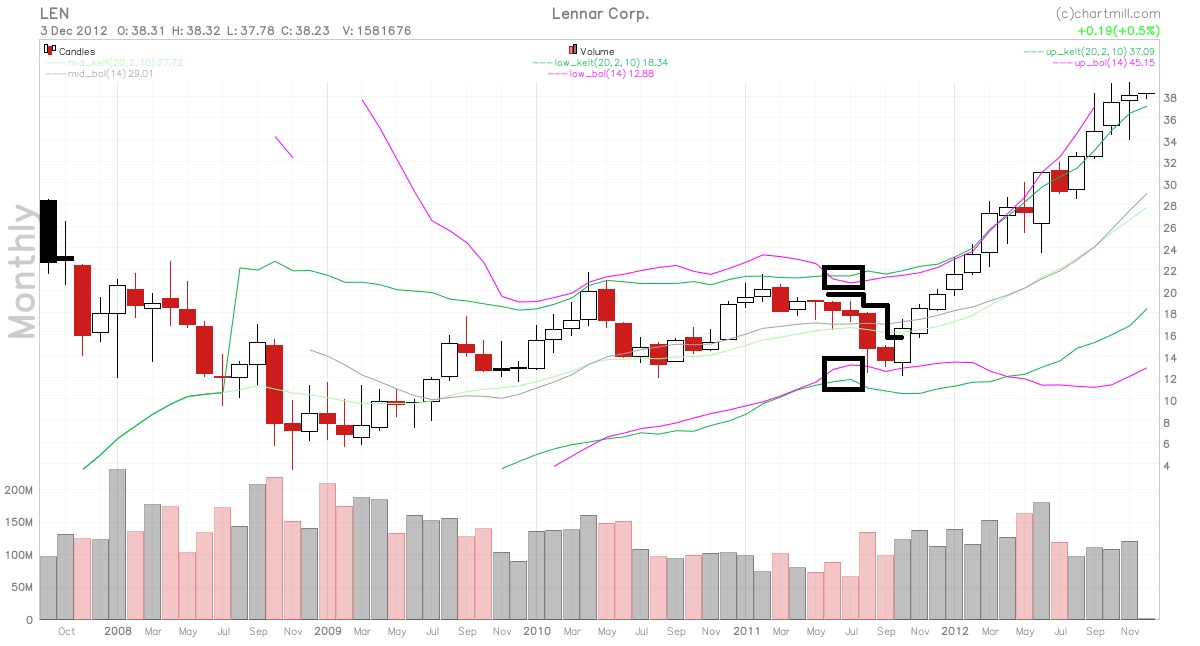
[HEADER] Breakout strategy on a very large timeframe
[CAPTION] Figure 2: When Bollinger Bands retract between Keltner Channels the setup gets armed. On this chart the strategy demands following the stock with a trailing buy stop above the monthly candle, although one could have tried to enter on a lower timeframe. Note that almost 5 months passed between the signal and the actual entry here.
[FIGURE 3]
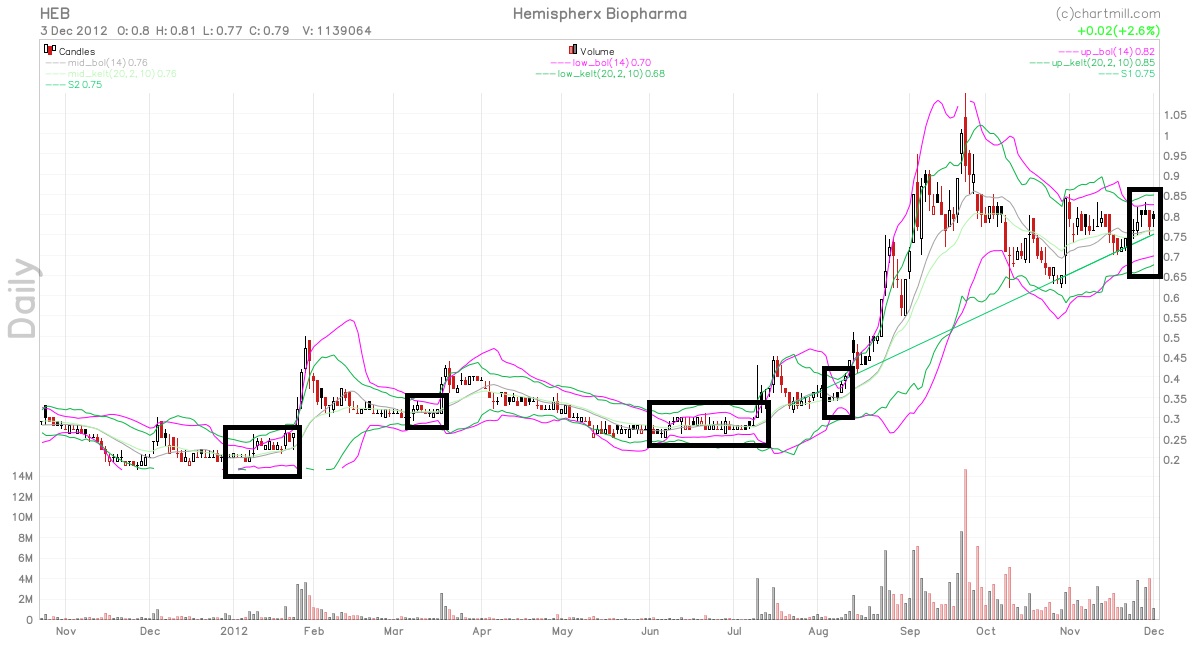
[HEADER] Breakout strategy on a smaller timeframe
[CAPTION] Figure 3: In this daily chart the breakout strategy was armed five times. Although longer periods of volatility contraction give birth to longer lasting trends, the short contractions can clearly be followed by very hefty volatility explosions as well.
[FIGURE 4]
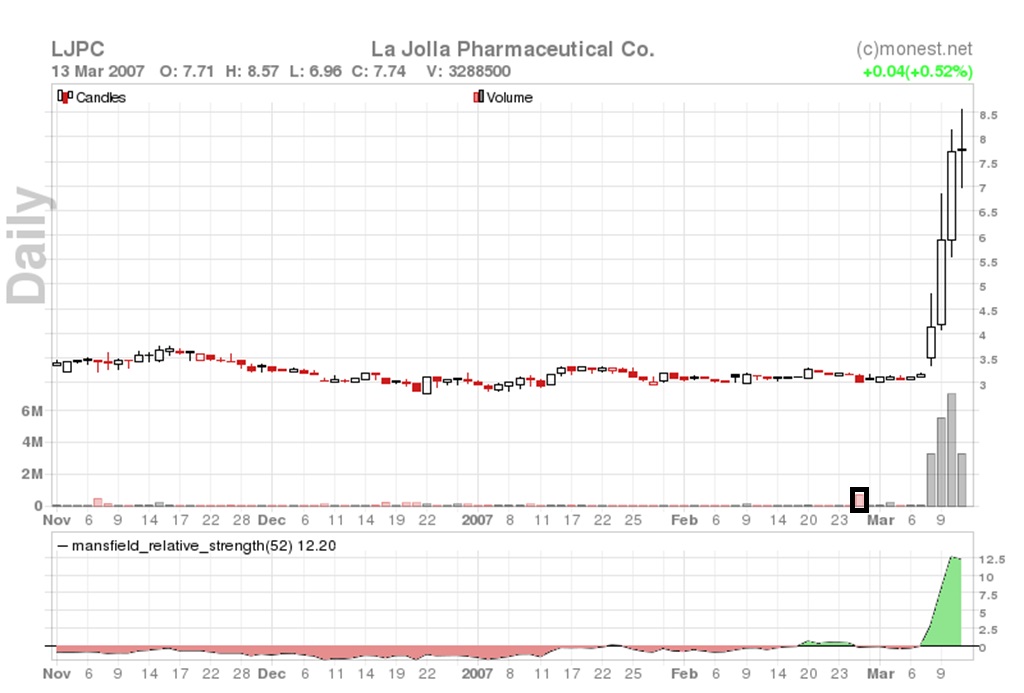
[HEADER] Volume Spike Alert
[CAPTION] Figure 4: This chart of a long gone story stock exemplifies a volume spike alert. While the volume that day was almost 17 times the 100 day average volume, there was no mentionable price movement, nor was there any news out or pending. Volatility, meanwhile, had dropped to flat line levels.
DIRK VANDYCKE is actively and independently studying the markets since 1995 with a focus on technical analysis, market dynamics and behavioral finance. He writes articles on a regular basis and develops software partly available at his co-owned website www.chartmill.com. Holding master degrees in both Electronics Engineering and Computer Science, he teaches software development and statistics at a Belgian University. He’s also an avid reader of anything he can get his hands on. He can be reached at dirk@monest.net.