Popular Screens: Momentum Squeeze Play Setups using Bollinger Bands
In this series we will discuss our popular screens a little bit more in depth. Also check out the general trading tips , which gives some general pointers.
The Momentum Squeeze Play screen is one of our most popular screens. It is not so hard to see why this screen is so popular as it finds stocks that are in a consolidation phase after a strong run up. Both Keltner Channels and Bollinger Bands are used for this screen. See these 3 results:
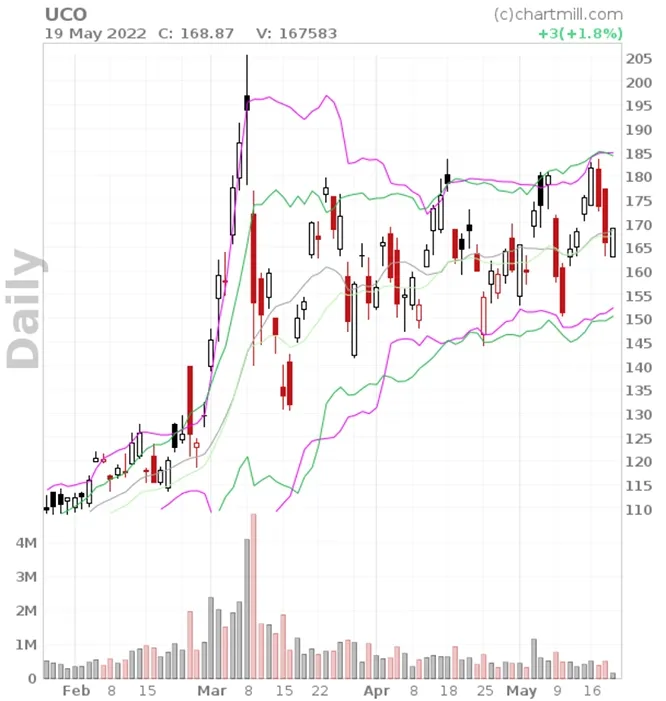
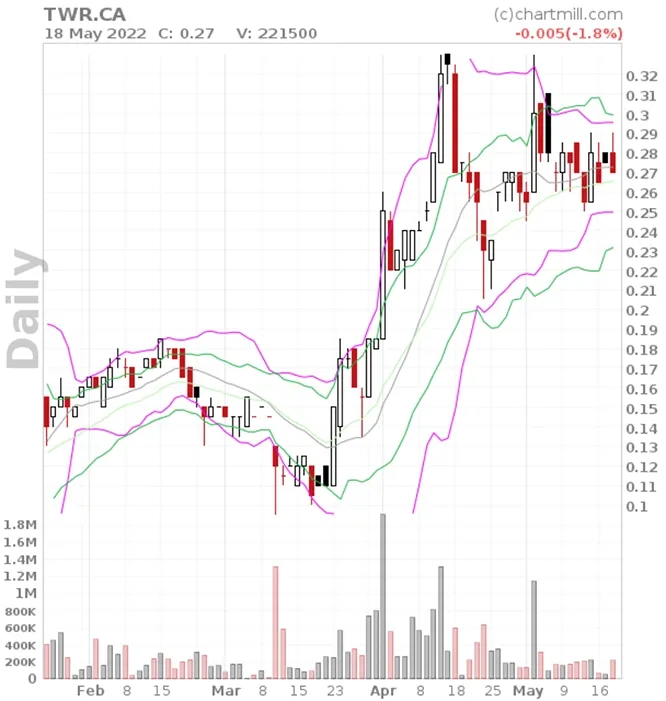
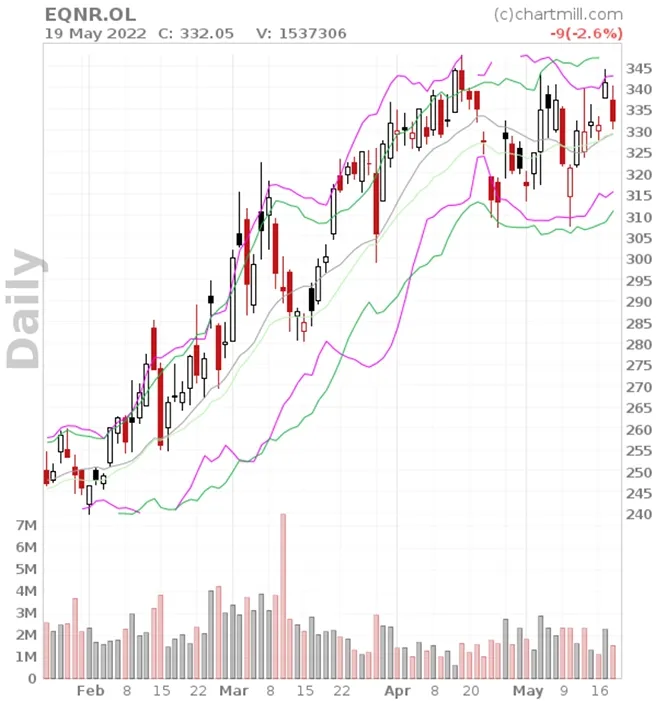
The idea is that stocks move in bursts. They have a strong move up and then they consolidate, which is really processing the new reality. Today, the stock is significantly higher than it was a couple of months ago. The sideways move tells us that these new levels are not rejected by the markets as trading is happening at these new levels. What we are looking for now is a breakout out of the consolidation zone where we expect the level of the consolidation zone to act as support.
One of the reasons why a breakout can work from a squeeze play setup is that because we have been trading around the same level for a while, a lot of new investors will be holding the stock with relatively low profits so far. This increases the possibility that these new holders will not sell immediately when the stock starts a new run.
An important thing to note here is that when the stock would fail and fall below the consolidation level, a dangerous situation occurs: we have all these new holders that would like to limit their loss and we may have some longer term holders that see their profits decrease. This tells us:
- Always wait until you see the actual breakout happening. While it is ok to build up a small position inside the base, a good way to handle these setups is by placing a buy stop above the consolidation level.
- Although squeeze plays are intended as a long setup, they may also make good short setups if the stock breaks down.
Tuning the screen and picking the right ones.
These are just some personal preferences of the author, but after opening the screen, I usually set the minimum price to 20 and the minimum volume to 'at least 500K'. This is just because I prefer stocks in this category, I usually even would go for at least 1 million average daily volume as liquidity is very important and avoids slippage.
Now, it's a matter of visually inspecting our output. What are we looking for? We are looking for those setups where we can put our stop not too far from the entry, so that we can take a sizable position, while limiting the total risk when the breakout fails.
We cannot stress enough that no technical pattern gives any guarantees. So we should always be prepared for failure. We should even assume failure and make sure that when failure happens, we are still alive. The whole point being: every now and then, we will have a successful breakout and this will make up for all our small losses.
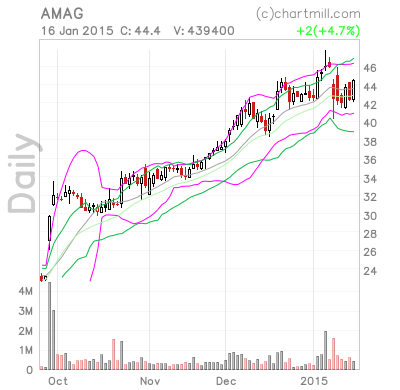
Let's make this a little more concrete. The above boils down that we are looking for tight formations that are close to their breakout level. Let's first show some examples of what we would reject:
Which ones do we consider?
Although many squeeze plays qualify as decent setups, it's always our job to look for the best ones. The next step I took was changing the chart settings to my personal chart settings: I'm adding the Effective Volume Indicator to visualize what large players are doing in the stocks.
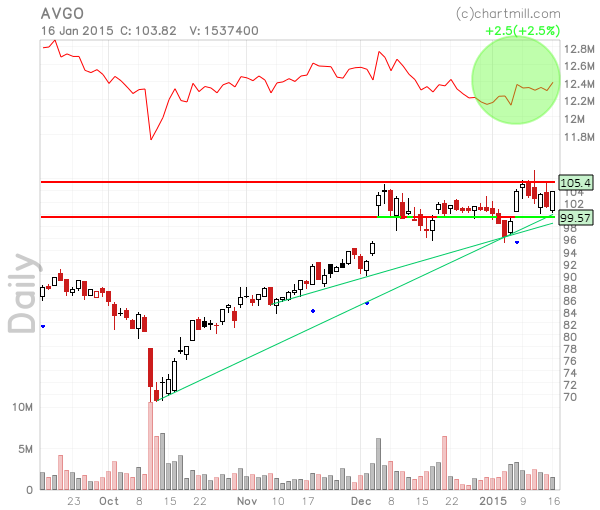
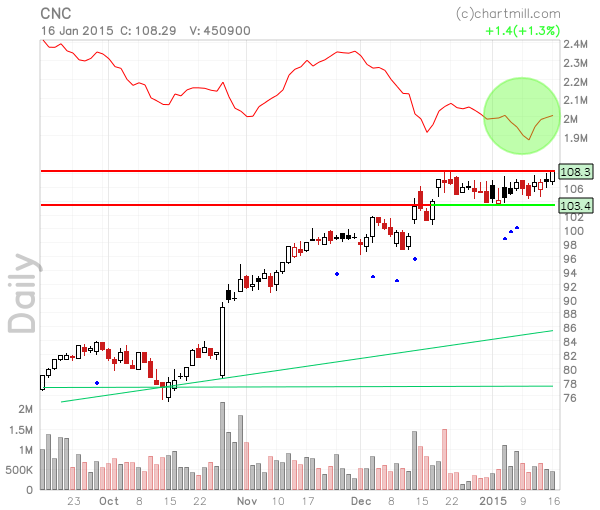
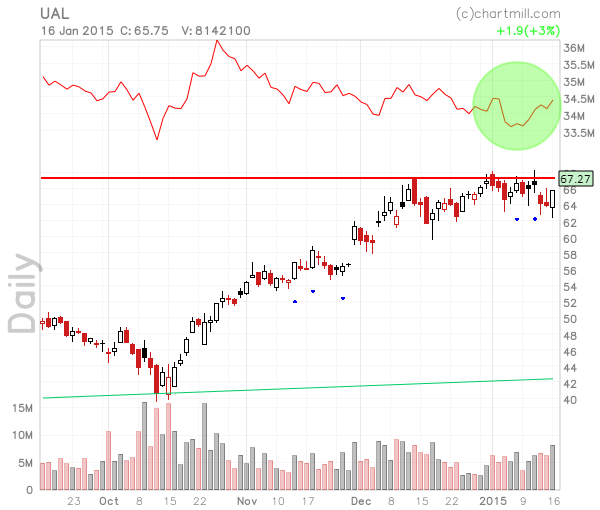
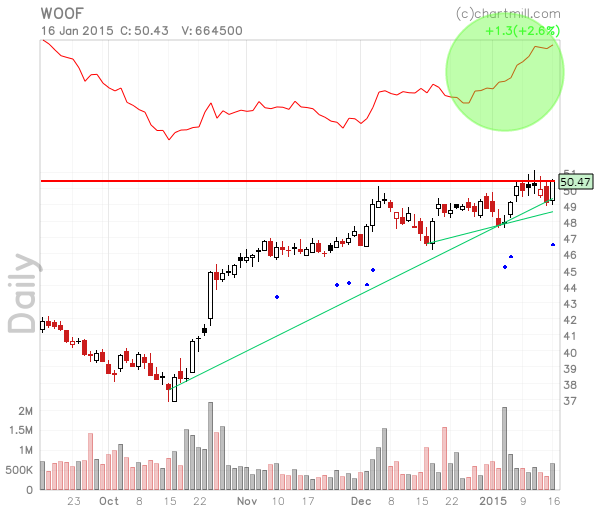
After going over the output again, I made a selection of 4 candidates that show:
- A nice Effective Volume pattern.
- A reasonably tight base, allowing a nice entry and exit.
- Multiple pocket pivots inside the base.
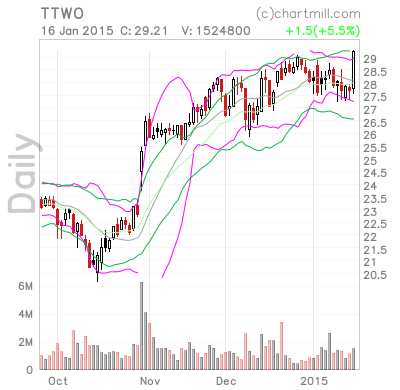
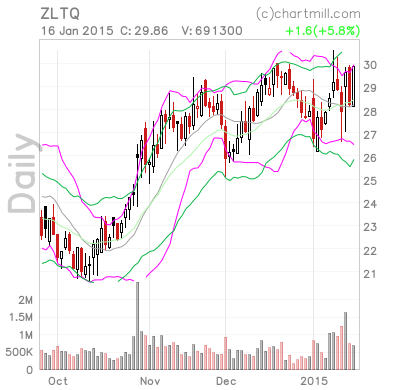
These are the selected charts: