Breakout Screens - Near 52 week High + High Relative Strength
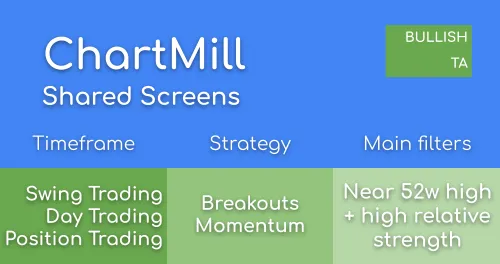
This screen finds strong stocks near a new high. This list allows you to find stocks 'about to make a new high'. Good bases still need to be found either by further filtering or by manual inspection.
Related Articles

Stocks at or near a New 52 week High or Low
Get a list of stocks making a new 52 week high or low on NYSE, NASDAQ, TSX, Euronext or S&P500

The Opening Range Breakout Strategy: Unlocking Profit Potential and Market Momentum
The opening range is formed between the highest and lowest price, immediately at market opening, up to a maximum of one hour after the opening. The opening range breakout strategy involves entering a long or short position as soon as the price breaks the initial opening range up or down.
Strong Stocks
Strong stocks are consistent strong performers in the market
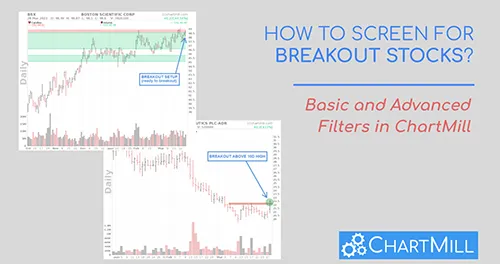
Breakout Stock Screener: How to Find Breakout Stocks Step by Step
Discover how to screen for breakout stocks or stock that are on the verge of doing so. Take advantage of specific price and volume filters and very sophisticated fully automated support and resistance recognition by ChartMill.

Popular Screens: Strong Stocks near New High
Learn how to find the strongest stocks in the market nearing a new high.
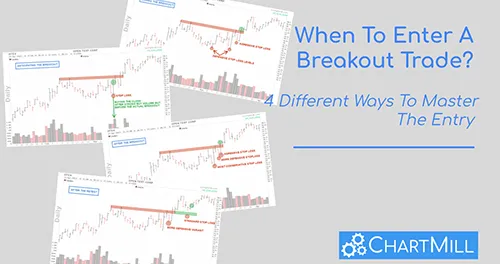
When To Enter A Breakout Trade? 4 Different Ways To Master The Entry
Learn when to enter a breakout trade in 4 different ways, each with its own advantages and disadvantages. Whether you're buying before, during, or after the breakout or waiting for a retest, identifying key levels and monitoring momentum are essential.
Relative Strength Performance Filter
Relative Strength measures price performance of a stock relative to the other stocks in the market.
Related Videos
Price: Above 10
This filter keeps only stocks that are trading higher than 10. Usually high growth stock investors ignore low priced stocks.
Signal2: Near 52 week High
This filters for stocks near a new 52 week high.
Average Volume: 50 SMA > 500K
This filters only keeps stocks with a minimum average daily volume of 500K.
Signal: Strong Stocks
This filters for strong stocks. Strong stocks are stocks with a high relative strength, but also a regular trend.
The chart shows the default settings: the 50 and 200 SMA and support and resistance lines.
Regional Run
Run this screen in your favorite region. You can always further fine tune the screen by changing the general settings after it opened in the screener.