
Stocks at or near a New 52 week High or Low
Typically when the term New High or New Low is used in relation to the stock market one is referring to a New 52 week high or New 52 week low. This indicates the stock is trading at it highest (or lowest) price when looking at the most recent period of 1 year (or 52 weeks). This signal is important to traders and investors as it gives you an idea on the sentiment for a specific stock. Also, when pulling the list of stocks that are making New Highs or New Lows you will get an idea about which stocks are behaving weakly or strongly in the current market.
The ChartMill Stock Screener has many predefined filters for various kinds of highs and lows. Using the stock screener, you can easily pull lists of all stocks making either a new high, or being near a high. Besides the 52 week period, other periods are supported. We will give an overview here.
Pulling a list of stocks making a 52 week high.
Once you are on the ChartMill Stock Screener page, you can go to the Performance tab. The first filter you see in called Signal and this is where all related pre-defined filters can be found:
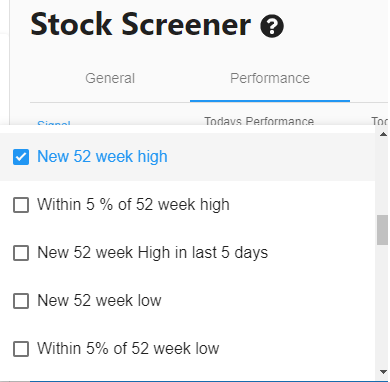
In the screenshot we are just listing the filters related to the 52 week highs and lows, but if you scroll down you will find many more for different periods. Pulling a list of stocks making a new 52 week high is as simple as selecting the filter. Of course, when you only select this filter, you will get the new highs on all supported exchanges. On the **General ** tab in the stock screener you can fine tune this a bit more. Some examples:
- New 52 week highs for US stocks
- New 52 week highs on Nasdaq
- New 52 week highs for stocks in the S&P500 Index
- New 52 week highs for stocks in the Russel 2000 Index
Pulling a list of stocks making a New 52 week Low.
Same story here, we just select New 52 week Low as signal and add some filters for the exchange, region or index we want to look at:
(You can easily swith between the charts or table view by selecting your preferred view on the blue results bar)
Near New High or Low
The stock screener also supports finding stock which are near a new high. 2 Examples:
- Stocks on the US market which made a new 52 week high in the passed week
- Stocks on the US market which are within 5% of their 52 week high
Of course, you can do the same for lows and if you would like 2% instead of 5%, keep on reading .... as this can all be done with custom expressions.
26 week, 13 week, 5, 10 or 20 days High and Low
Besides the 52 week period the stock screener supports many other periods, both mid term and short term. As mentioned before, you can find all of these filters under signal on the performance tab of the stock screener.
Get the New 52 week Highs or Lows from the market overview pages.
The market overview pages contain a New 52 Week High and Low section. Here you can quickly see the list of new highs and lows and click through to the stock screener for the full list.
Didn't find what you need? Custom expressions to the rescue!
Everything you can screen for is called a property of the stock. You can find an overview of all properties here. On the custom tab of the stock screener you can build custom expressions with these properties. An expression has the following parts:
- LHS : the left hand side of the expression.
- Comparison: the comparison operation.
- RHS: the right hand side of the expression.
This may be a little bit intimidating at first, but it is really straightforward. When I have the expression a > b, a is the left hand side, > is the comparison operator and b is the right hand side. Both sides can be either:
- A property as described in the documentation
- A constant, like 5 or 25 or 0.125
- An expression with mathematical operator ( like +, -, *, /) and again two sides.
This all implies that we can do pretty much whatever we want with these expressions. For instance, when I want to find a list of stocks which are 30% below their 52 week high, but also at least 10% above their 52 week low, I can add the following expressions:
- (Current Price) < ( (52 week High) * 0.7) )
- (Current Price) > ( (52 week Low) * 1.1) )
As you can see, we use the constant 0.7 to multiply with the 52 week high. So if the high is 100, the stock should be below 70. Here is a direct link to the example:
Stocks which are 30% below their 52 week high, but also at least 10% above their 52 week low