
3 Breakout Swing Trading Ideas Before Market Opening
Last update: Nov 16, 2022
For today, Thursday, Nov. 16, 2022, we have selected 3 technical breakout swing trading setups that you should keep an eye on when market sentiment remains positive.
This particular screen filter was used to look for stocks that breakout above their 10-day high but whose price is still below its annual high.
You can read more about the breakout strategy in this article.
Walmart Inc.
NYSE: WMT
GICS Sector: Consumer Staples
GICS Industry: Food & Staples Retailing
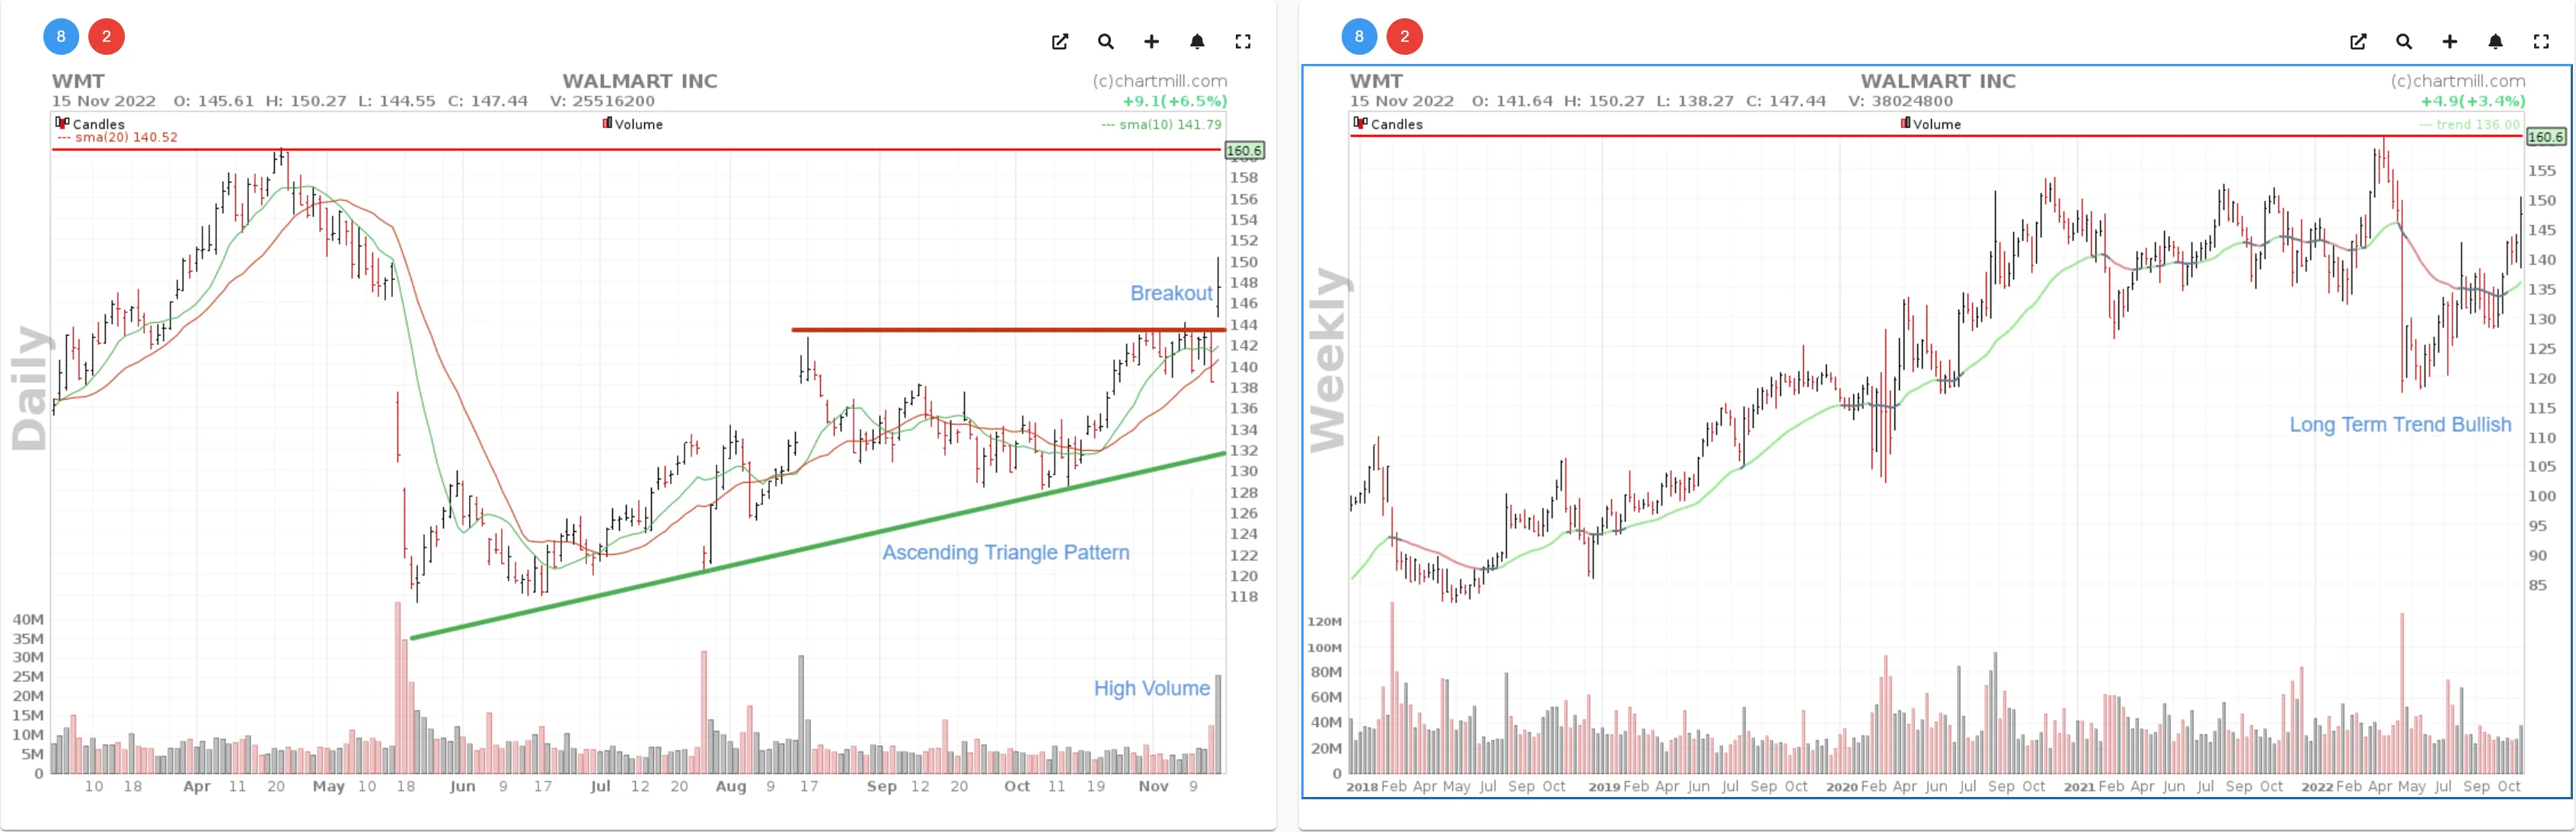
Walmart shares went down heavily in mid-May but were able to recover strongly from that price level with the formation of an ascending triangle pattern. The long-term trend on the weekly chart on the right - based on the ChartMill Trend Indicator - has changed from neutral to positive four weeks ago. The daily chart clearly shows the upward breakout, which occurred with significantly increased volume.
Initial price target is at $160.
GoGo Inc.
NASDAQ: GOGO
GICS Sector: Communication Services
GICS Industry: Wireless Telecommunication Services
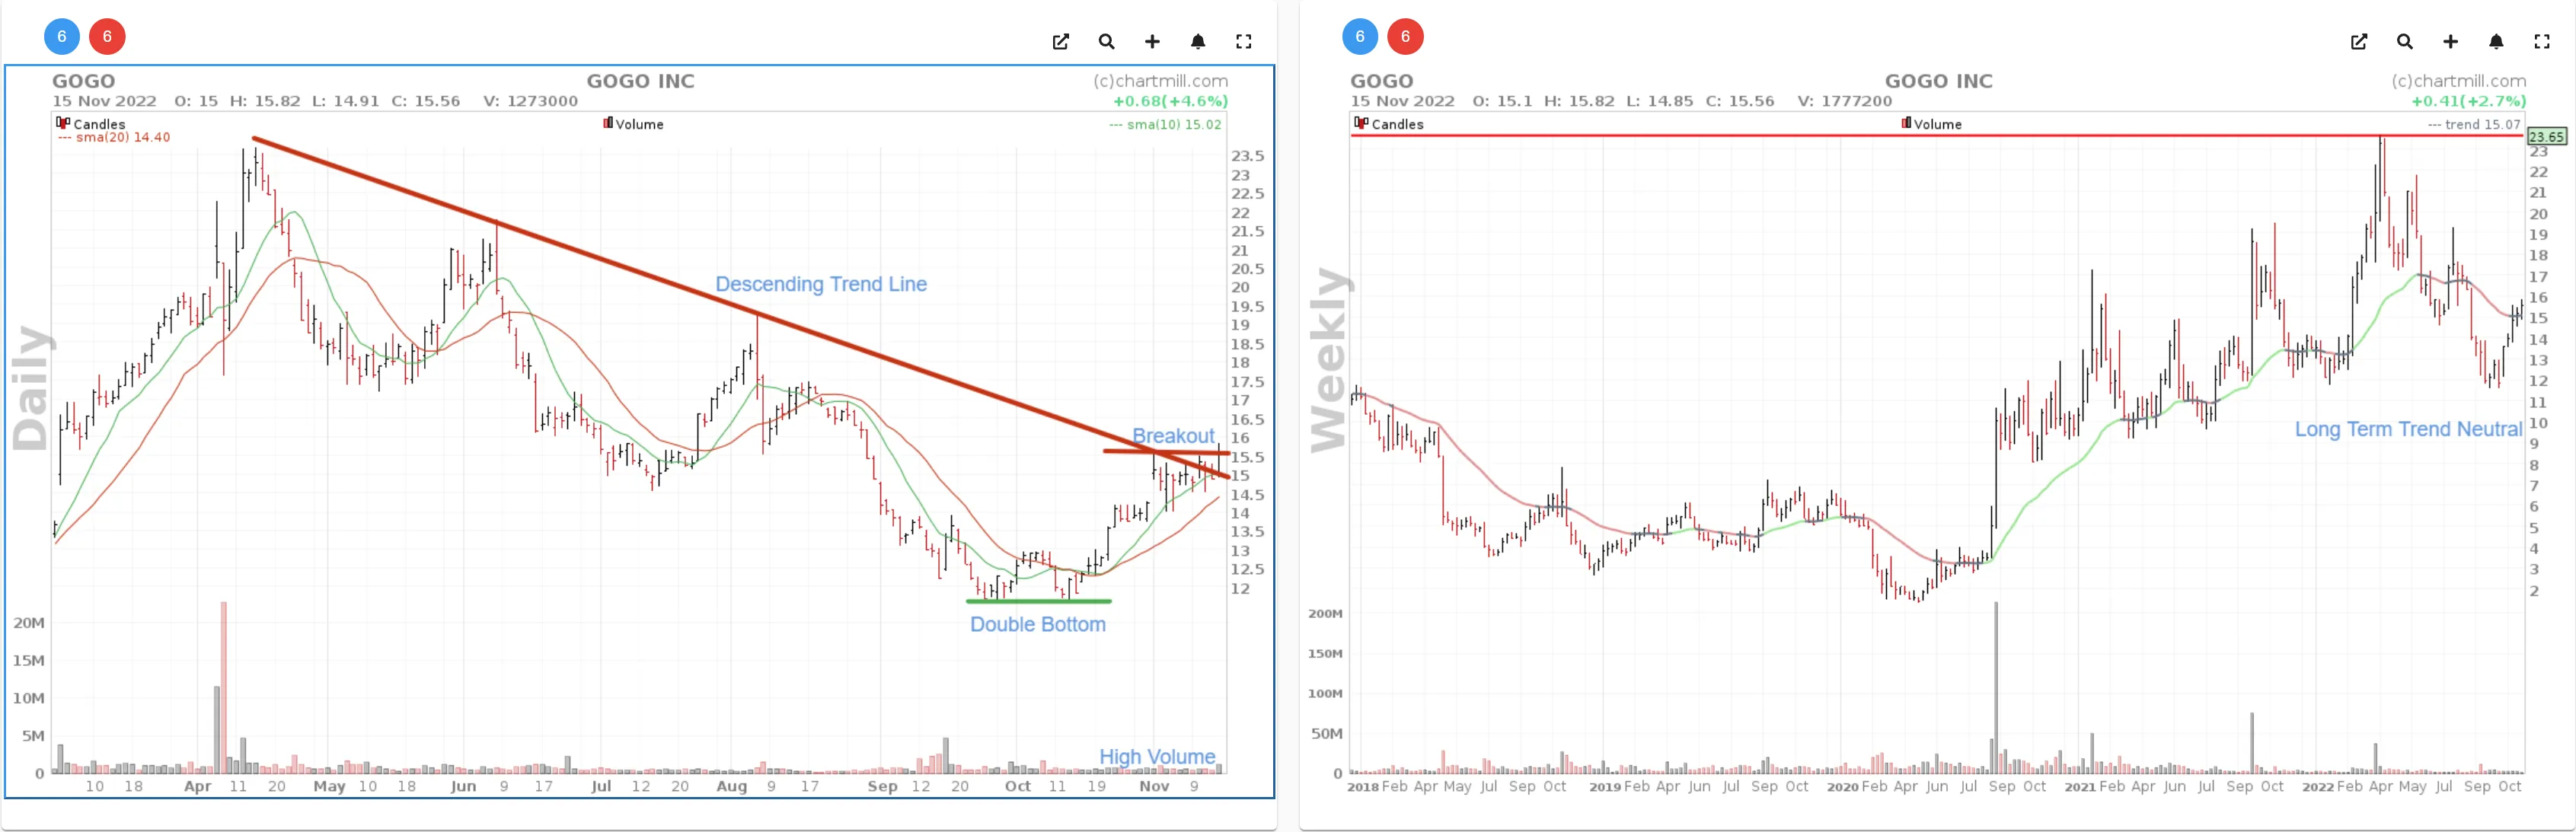
The weekly chart shows Gogo's price at the upper end of a downward trend channel. The ChartMIll Trend indicator changed from negative to neutral about two weeks ago. On the daily chart, a double price bottom can be recognized from where the price has started to rise again. The trend on the daily chart has been bullish since the second week of October. Yesterday the price broke out upward from a mini sideways range. Volume was noticeably higher in the process.
Short-term price target is at $19, long-term $23.
ALTAIR ENGINEERING Inc.
NASDAQ: ALTR
GICS Sector: Information Technology
GICS Industry: Software
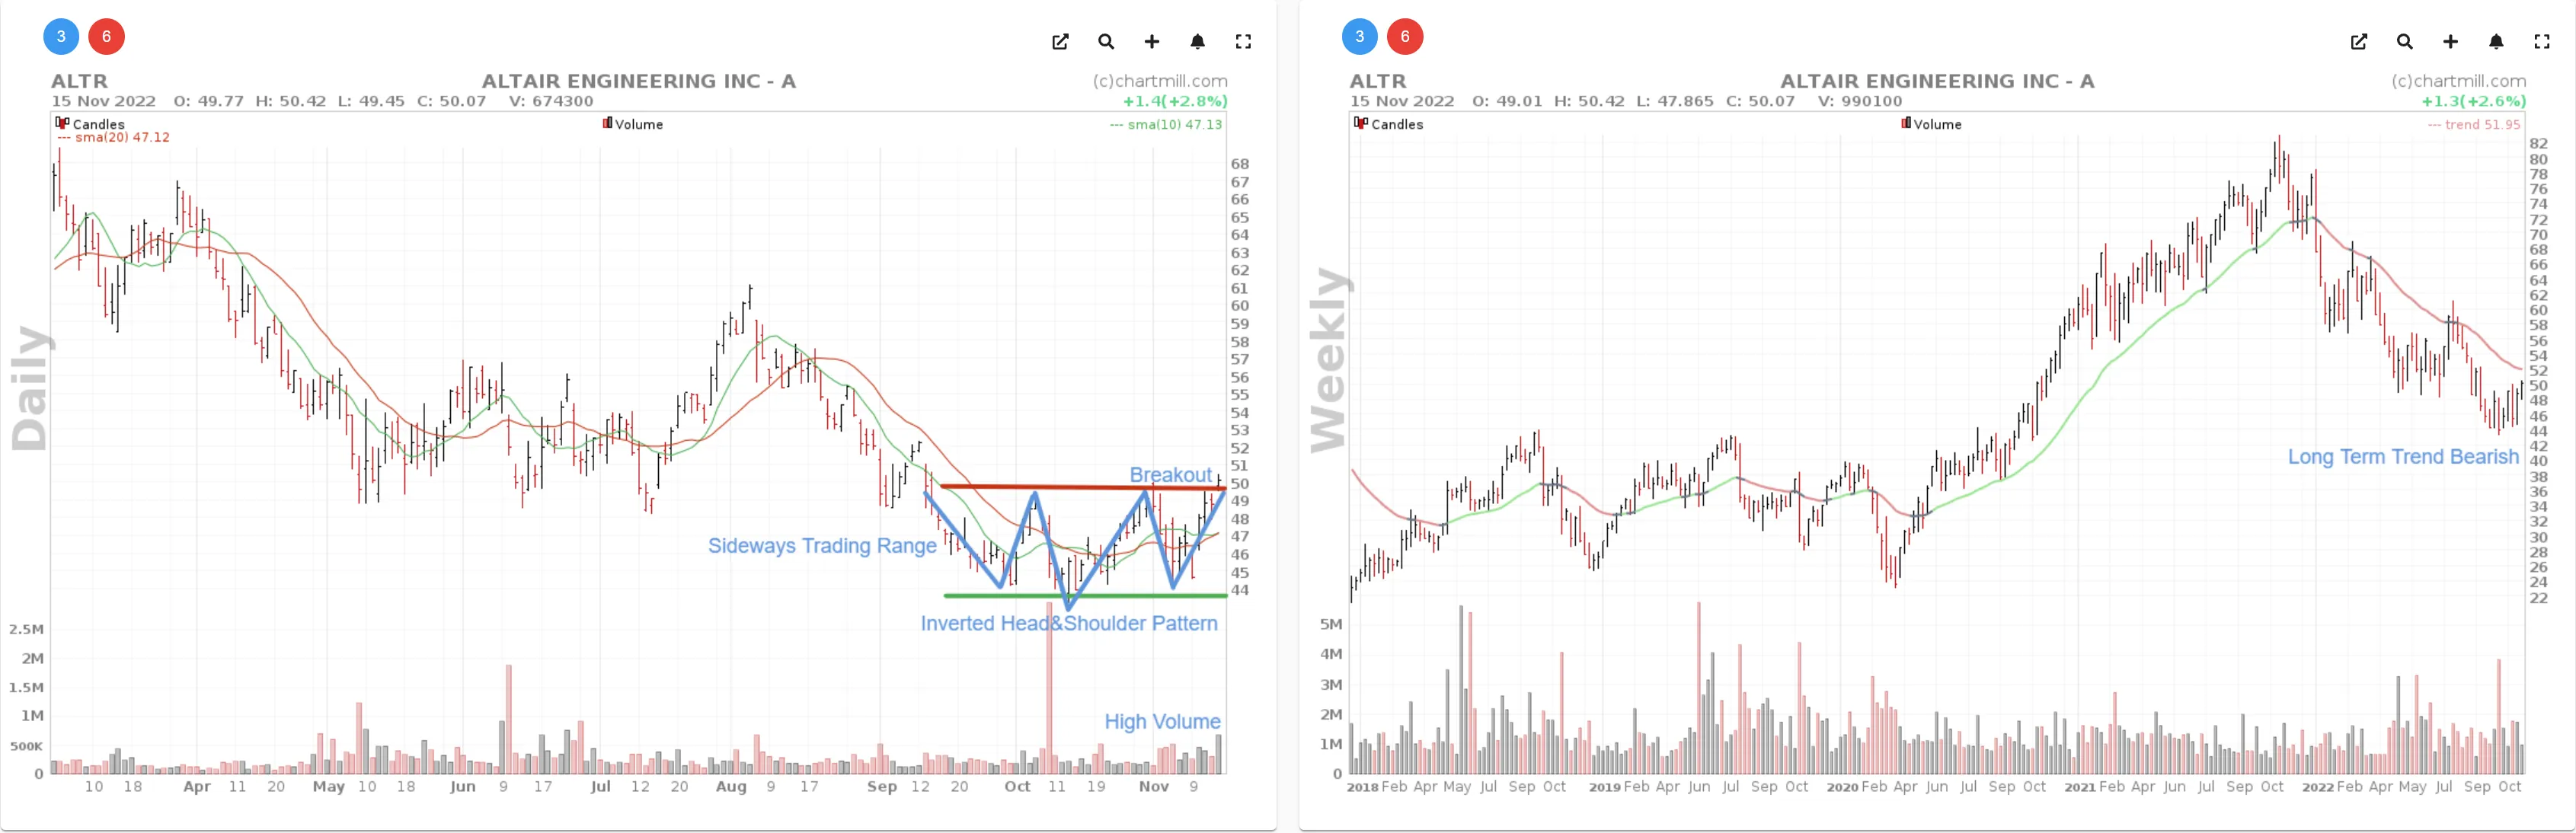
Altair stock was particularly notable for its clear bottom formation on the daily chart. There is a sideways price range within which an inverted head&shoulder pattern is visible. The price is currently flirting with the upper limit of that pattern. However, the long-term trend is still bearish with a succession of lower tops and lower bottoms on the weekly chart.
Should the price recovery do continue, the first target is the most recent lower high on the weekly chart, around $60.
NYSE:WMT (5/12/2025, 3:46:08 PM)
96.4282
-0.29 (-0.3%)
111.85
+0.16 (+0.14%)
NASDAQ:GOGO (5/12/2025, 3:46:05 PM)
12.22
+1.22 (+11.09%)
Find more stocks in the Stock Screener
