
For investors looking to join solid fundamental growth with positive technical patterns, a multi-layered screening method can be very useful. One approach finds companies that show strong high-growth momentum traits while also displaying a good technical arrangement for a possible entry. This strategy selects stocks with a ChartMill High Growth Momentum (HGM) Rating greater than 4, pointing to good earnings and sales momentum, together with a Technical Rating and a Setup Rating both above 7. The last two scores confirm the stock is in a clear uptrend and is now forming a pattern that could come before a new upward move. This combination tries to locate chances where strong business fundamentals are matched by positive price movement.
NVIDIA CORP (NASDAQ:NVDA) appears as a leading instance from this filter, receiving a 7 on the HGM Rating and an 8 on both the Technical and Setup Ratings. The company's place at the leading edge of accelerated computing and artificial intelligence has resulted in outstanding financial results, which is exactly what the HGM Rating aims to measure.
Fundamental Growth Momentum
The High Growth Momentum Rating for NVIDIA is formed on a base of outstanding and speeding financial measures. The rating combines past results, current speed, and future projections, all of which are notably positive for the chipmaker.
- Strong Earnings Growth: The company's earnings per share (EPS) growth on a trailing twelve-month (TTM) basis is more than 60%. Significantly, the quarterly speed stays high, with the last reported quarter showing year-over-year EPS growth near 60.5%. Analysts predict this speed to persist, with projections for the next quarter indicating growth above 74%.
- Solid Sales Increase: Revenue growth follows a comparable path. TTM sales growth is more than 65%, with the latest quarter growing over 62% compared to the year before. This top-line force verifies that demand for NVIDIA's platforms is wide and lasting.
- Widening Profitability and Positive Surprises: A main part of the HGM Rating is growing profitability. NVIDIA's profit margin has greatly increased over recent years, changing from 16.2% two fiscal years ago to 55.8% in the last full year, showing great operating efficiency. Also, the company has exceeded EPS projections in each of the last four quarters, with an average surprise of 2.09%, showing steady performance ahead of expectations.
- Analyst Optimism: The future view stays positive, as seen by upward changes. Over the past three months, analysts have increased their average EPS projection for the next fiscal year by 4.09% and their revenue projection by 3.21%, giving more support to the growth story.
These elements together support the positive HGM Rating. For a high-growth momentum investor, this mix of high growth levels, acceleration, widening margins, and rising estimate changes is important, as it implies the company is in a strong phase of its business cycle.
Technical Health and Setup Condition
While fundamentals give the "why," technical analysis supplies the "when." NVIDIA's technical picture, as described in its ChartMill Technical Report, matches its fundamental health, presenting a positive risk/reward arrangement.
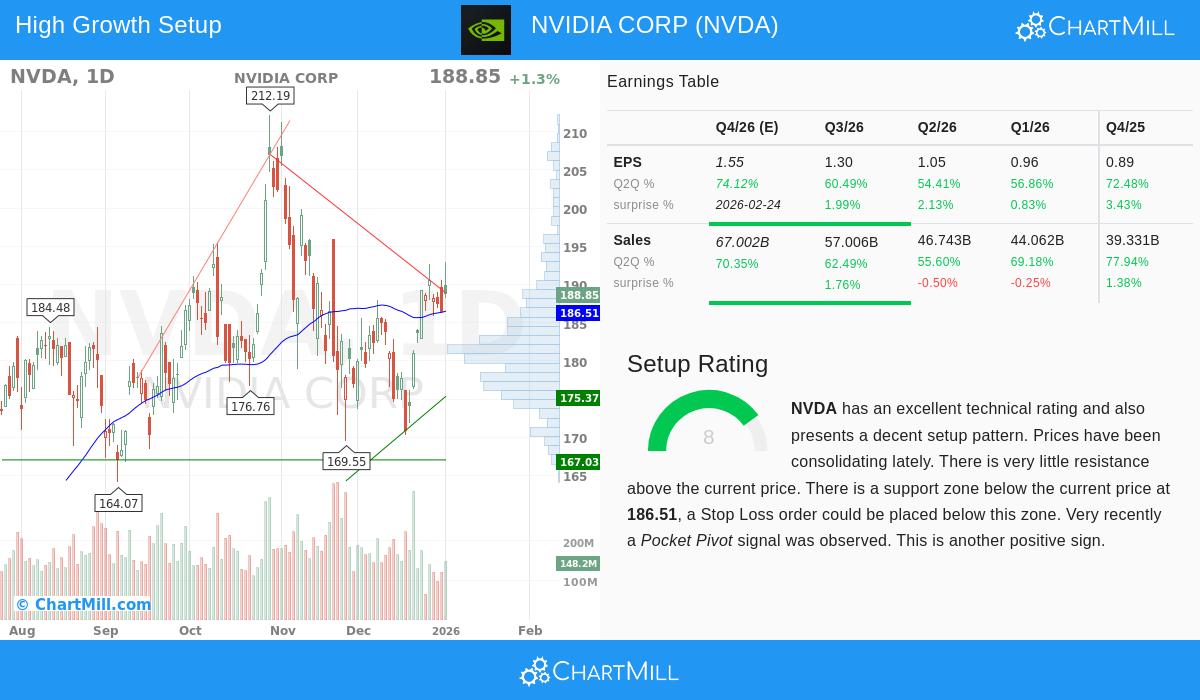
- Positive Technical State: With a Technical Rating of 8, NVIDIA is verified to be in a continued uptrend. Both its short-term and long-term trends are rated as good, and the stock is trading above important moving averages (20, 50, 100, and 200-day), which are all increasing. This shows wide buying support across many timeframes.
- Formation for Possible Advance: The Setup Rating of 8 emphasizes that the stock is not stretched but is instead in a time of formation. The report states that NVIDIA is now showing a bull flag pattern, a halt after a strong rise that frequently comes before a trend continuation. This forms a possible entry place for investors.
- Defined Support and Resistance: The technical analysis finds a clear support area between about $181.75 and $186.51, made by a combination of trendlines and moving averages. This gives a sensible zone for a stop-loss order. Resistance is seen near $188.88. A clear move above this level could indicate the next part of the uptrend.
The match of a positive technical uptrend with a constructive formation pattern is what makes this arrangement attractive. It suggests the stock is pausing inside a larger upward trend, possibly giving a defined entry point before its next move.
Conclusion
NVIDIA CORP presents a notable case where excellent fundamental growth momentum meets a technically positive chart pattern. The company's leading market position is driving outstanding earnings and sales growth, which is shown by its high HGM Rating. At the same time, the stock's price movement reflects this health through a steady uptrend and is now giving a possible entry by a bull flag formation, as shown by its high Technical and Setup Ratings.
For investors using this joined growth-and-setup method, NVIDIA acts as a clear example of the kind of chance the filter is made to find. It is necessary to do more individual research, thinking about valuation and wider market factors, but the match of these numerical factors is significant.
Interested in locating more stocks that match this high-growth momentum breakout profile? You can execute the filter yourself using this High Growth Momentum Breakout Setups Screen.
Disclaimer: This article is for information only and does not form investment advice, a suggestion, or an offer to buy or sell any security. The analysis uses given data and should not be the only ground for an investment choice. Investors should perform their own study and talk with a qualified financial advisor before making any investment decisions. Past results are not a guide for future outcomes.