
Technical breakout strategies aim to identify stocks that are both technically strong and forming consolidation patterns, suggesting a potential upward price movement. This approach combines two key metrics: a high Technical Rating to confirm the stock is in a healthy uptrend, and a high Setup Quality Rating to indicate it is trading in a tight range, potentially poised for a breakout. By focusing on stocks that meet these criteria, investors seek to enter positions as a stock begins a new leg up from a period of stability, aiming to capture gains while managing risk with clearly defined support levels.
NVIDIA CORP (NASDAQ:NVDA) recently appeared on such a scan, presenting a profile that may interest investors employing this methodology. The stock's current technical posture and chart pattern offer a concrete example of how these principles can be applied in a live market scenario.
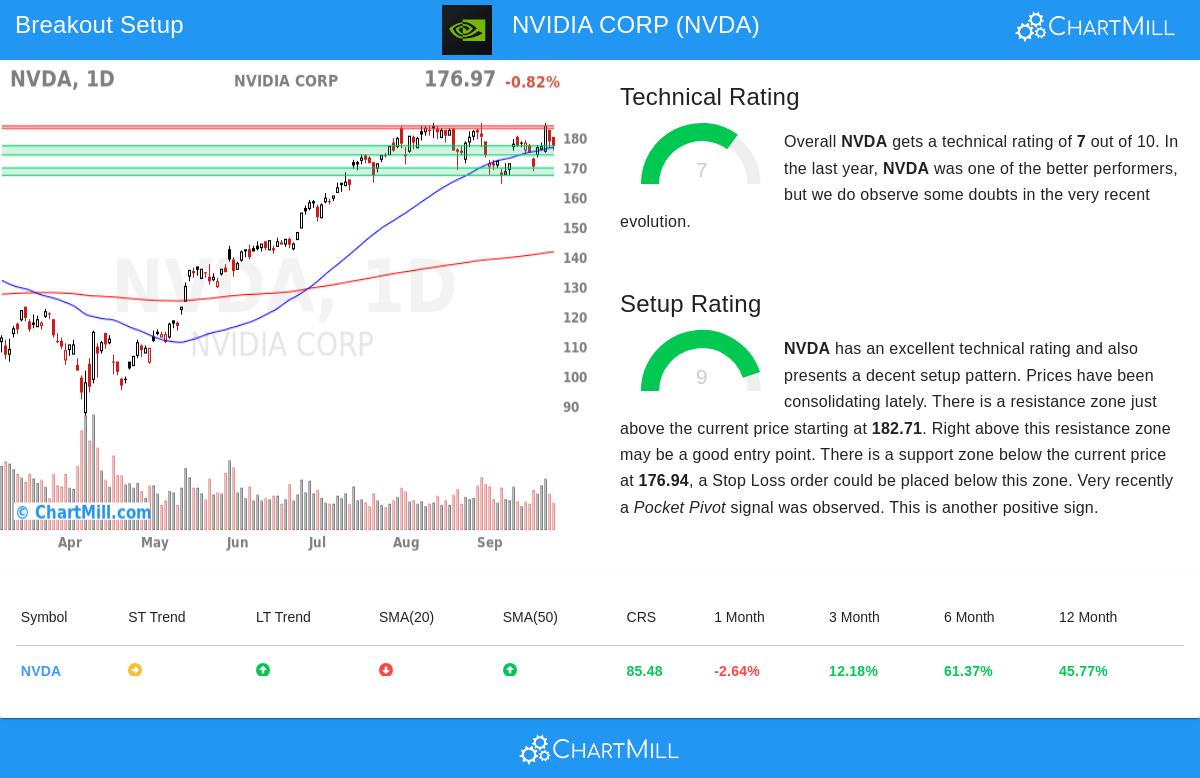
Technical Health Assessment
The foundation of a breakout strategy is a technically sound stock, and NVIDIA earns a solid Technical Rating of 7 out of 10. This score reflects its position as a market leader over the past year, outperforming 85% of all stocks. The long-term trend remains firmly positive, supported by the stock trading above its key moving averages (50-day, 100-day, and 200-day). While the short-term trend is currently neutral, this is not uncommon during consolidation phases and does not necessarily detract from the overall bullish structure. A stock with a strong technical rating is crucial for this strategy because it increases the probability that any breakout will be sustained, rather than being a false signal in a weak stock.
Key technical highlights include:
- Long-Term Outperformance: The stock has significantly outperformed the broader market over a 12-month period.
- Industry Leadership: Within the competitive Semiconductors & Semiconductor Equipment industry, NVIDIA outperforms 71% of its peers.
- Proximity to Highs: The stock is trading near its 52-week high, a characteristic often associated with strong momentum names.
A more detailed breakdown of these technical factors is available in the full technical report.
Setup Quality and Potential Trade Structure
While technical strength identifies which stock to watch, the setup quality answers when to consider an entry. NVIDIA presents an excellent Setup Rating of 9, indicating a high-quality consolidation pattern. The stock has been trading within a defined range over the past month, with clear support and resistance levels emerging. This consolidation is a positive sign, as it allows the stock to digest its previous gains and build a base for a potential next move higher. A high setup rating is vital as it provides a clear framework for risk management, offering logical levels for entry and stop-loss orders.
The current chart structure suggests a potential trading setup:
- Resistance Zone: A defined resistance area exists between $182.71 and $183.62.
- Support Zone: A strong support zone is identified between $173.85 and $176.94, formed by a confluence of trendlines and moving averages.
- Proposed Entry: A breakout above the resistance zone, say with a buy-stop order at $183.63, could signal the start of a new upward leg.
- Proposed Exit: A stop-loss order placed just below the support zone, around $173.84, would help define and limit the risk on the trade.
This structure creates a scenario where the potential reward justifies the calculated risk. The recent appearance of a "Pocket Pivot" signal, where the price advances on higher-than-average volume, adds a further positive note, suggesting institutional accumulation during the consolidation.
Market Context and Liquidity
The broader market environment provides a supportive backdrop for such setups. Both the long-term and short-term trends for the S&P 500 are positive, which generally favors breakout attempts in leading stocks like NVIDIA. Furthermore, the stock exhibits strong liquidity, with an average daily trading volume well over 170 million shares. High liquidity is an important, though sometimes overlooked, component for technical traders, as it ensures the ability to enter and exit positions efficiently without significant price impact.
Finding Similar Opportunities
The methodology that identified NVIDIA's setup can be applied systematically to uncover new opportunities daily. Investors looking for other stocks exhibiting strong technicals and high-quality consolidation patterns can run the same screen. You can find the current list of technical breakout candidates by visiting the Technical Breakout Setups screen.
Disclaimer: This article is for informational purposes only and does not constitute investment advice, a recommendation, or an offer to buy or sell any security. The trading setup described is an automated example for educational illustration and is not a suggestion to execute a trade. Always conduct your own research, consider your risk tolerance, and consult with a qualified financial advisor before making any investment decisions. Past performance is not indicative of future results.