Unearth the potential of MICROSOFT CORP (NASDAQ:MSFT) as a dividend stock recommended by our stock screening tool. MSFT maintains a robust financial footing and delivers a sustainable dividend. We'll delve into the details below.
Dividend Analysis for MSFT
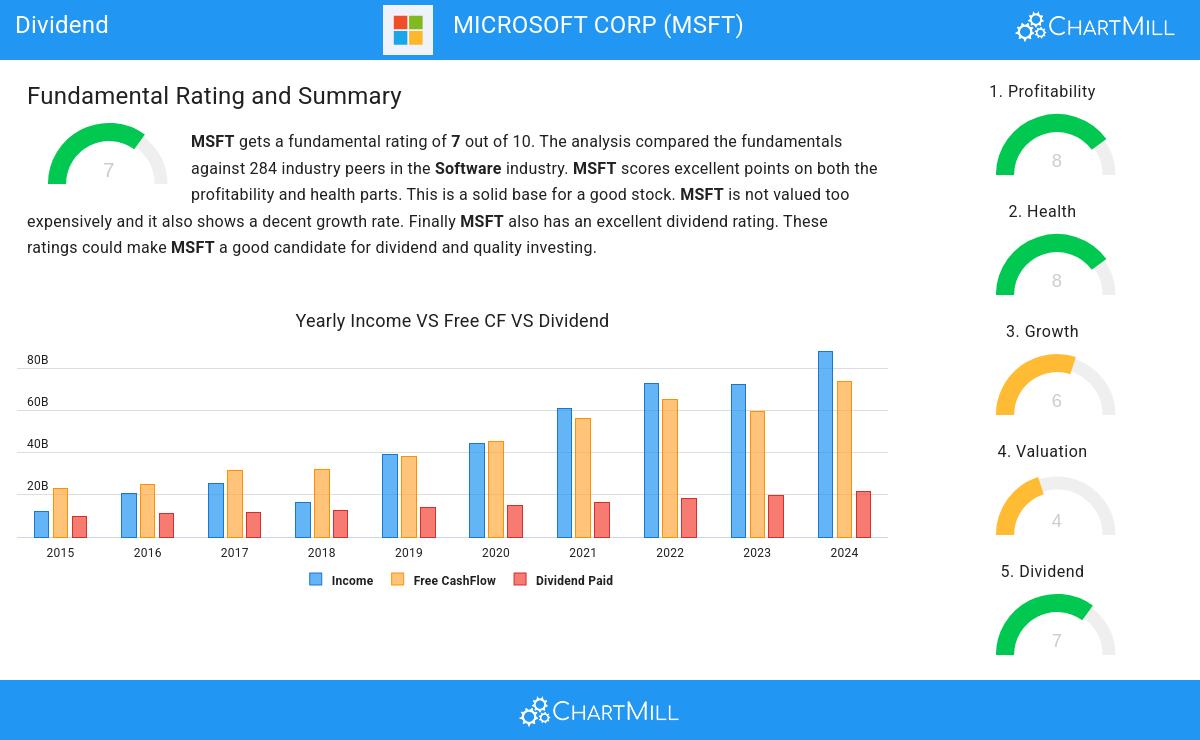
An integral part of ChartMill's stock analysis is the Dividend Rating, which spans from 0 to 10. This rating evaluates diverse dividend factors, including yield, historical data, growth, and sustainability. MSFT has received a 7 out of 10:
- Compared to an average industry Dividend Yield of 14.33, MSFT pays a better dividend. On top of this MSFT pays more dividend than 92.25% of the companies listed in the same industry.
- On average, the dividend of MSFT grows each year by 10.19%, which is quite nice.
- MSFT has been paying a dividend for at least 10 years, so it has a reliable track record.
- MSFT has not decreased their dividend for at least 10 years, which is a reliable track record.
- 24.30% of the earnings are spent on dividend by MSFT. This is a low number and sustainable payout ratio.
- The dividend of MSFT is growing, but earnings are growing more, so the dividend growth is sustainable.
Understanding MSFT's Health
ChartMill assigns a proprietary Health Rating to each stock. The score is computed by evaluating various liquidity and solvency ratios and ranges from 0 to 10. MSFT was assigned a score of 8 for health:
- MSFT has an Altman-Z score of 9.96. This indicates that MSFT is financially healthy and has little risk of bankruptcy at the moment.
- With an excellent Altman-Z score value of 9.96, MSFT belongs to the best of the industry, outperforming 87.68% of the companies in the same industry.
- MSFT has a debt to FCF ratio of 1.18. This is a very positive value and a sign of high solvency as it would only need 1.18 years to pay back of all of its debts.
- MSFT has a better Debt to FCF ratio (1.18) than 72.18% of its industry peers.
- MSFT has a Debt/Equity ratio of 0.24. This is a healthy value indicating a solid balance between debt and equity.
- The current and quick ratio evaluation for MSFT is rather negative, while it does have excellent solvency and profitability. These ratios do not necessarly indicate liquidity issues and need to be evaluated against the specifics of the business.
Understanding MSFT's Profitability
ChartMill employs its own Profitability Rating system for stock evaluation. This score, ranging from 0 to 10, is derived from an analysis of diverse profitability metrics and margins. In the case of MSFT, the assigned 8 is noteworthy for profitability:
- MSFT has a Return On Assets of 17.18%. This is amongst the best in the industry. MSFT outperforms 92.61% of its industry peers.
- MSFT has a better Return On Equity (30.02%) than 90.14% of its industry peers.
- With an excellent Return On Invested Capital value of 22.17%, MSFT belongs to the best of the industry, outperforming 95.42% of the companies in the same industry.
- MSFT had an Average Return On Invested Capital over the past 3 years of 23.84%. This is significantly above the industry average of 12.17%.
- MSFT has a Profit Margin of 35.79%. This is amongst the best in the industry. MSFT outperforms 95.42% of its industry peers.
- In the last couple of years the Profit Margin of MSFT has grown nicely.
- With an excellent Operating Margin value of 45.23%, MSFT belongs to the best of the industry, outperforming 99.30% of the companies in the same industry.
- MSFT's Operating Margin has improved in the last couple of years.
Every day, new Best Dividend stocks can be found on ChartMill in our Best Dividend screener.
For an up to date full fundamental analysis you can check the fundamental report of MSFT
Keep in mind
This is not investing advice! The article highlights some of the observations at the time of writing, but you should always make your own analysis and invest based on your own insights.