The market came into Monday with a tricky backdrop. The geopolitical headlines were serious, oil spiked hard intraday, and yet equities still finished higher.
Index Overview (SPY, QQQ, IWM)
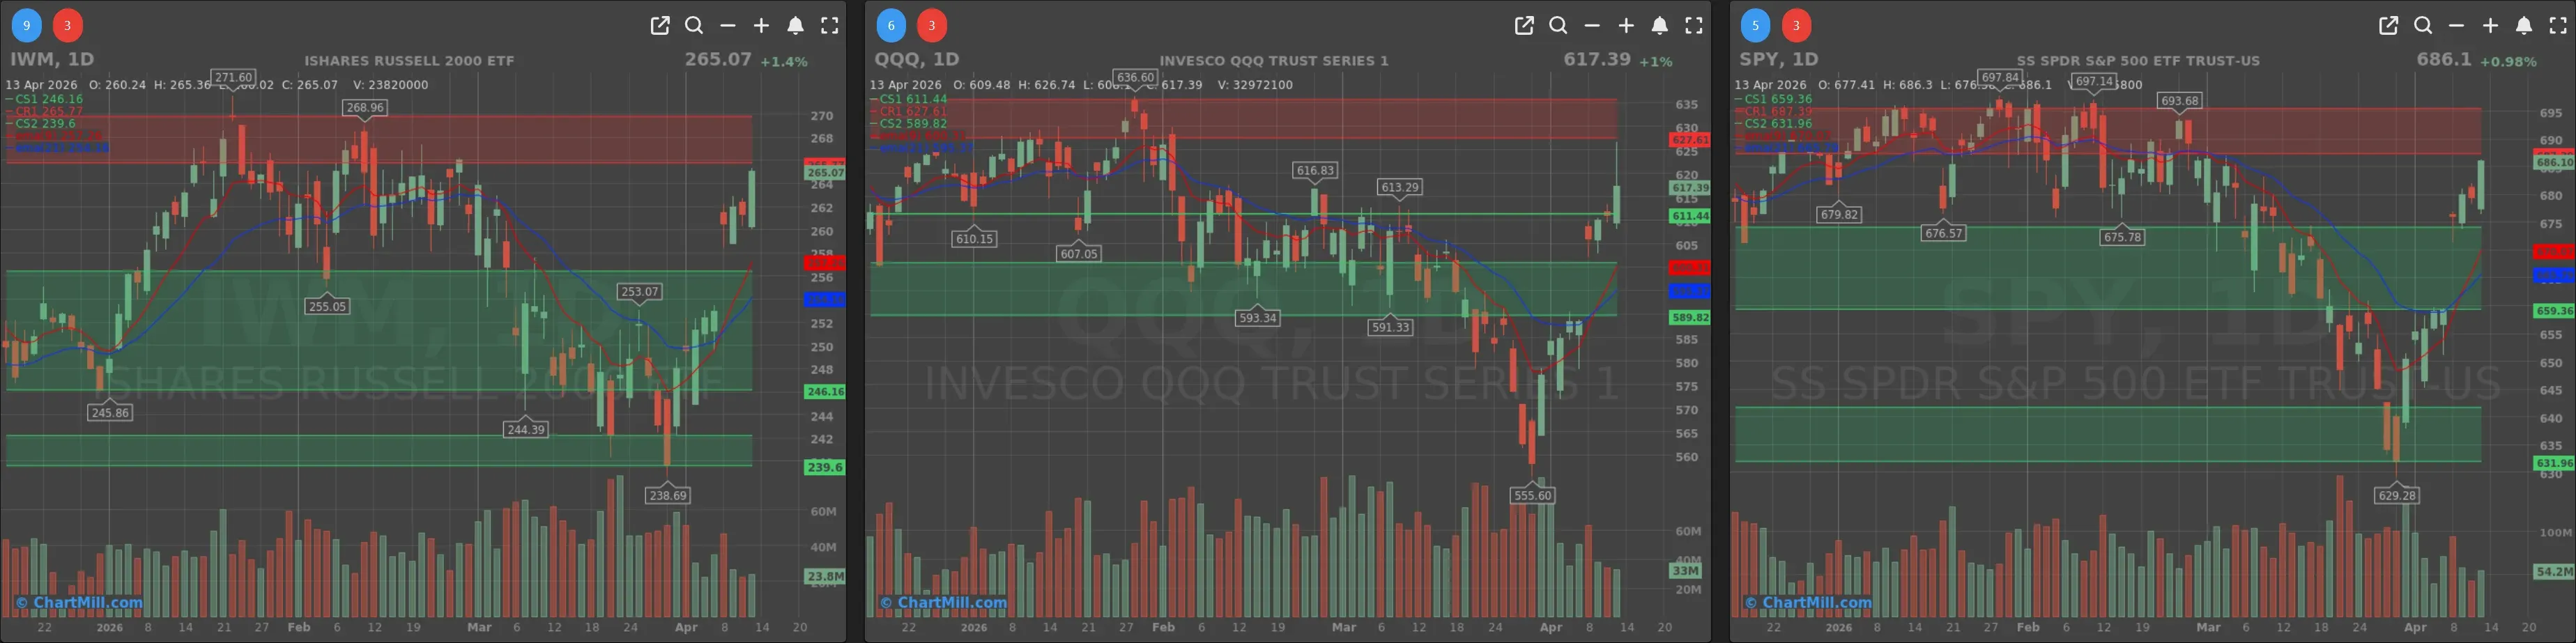
Short Term (Daily)
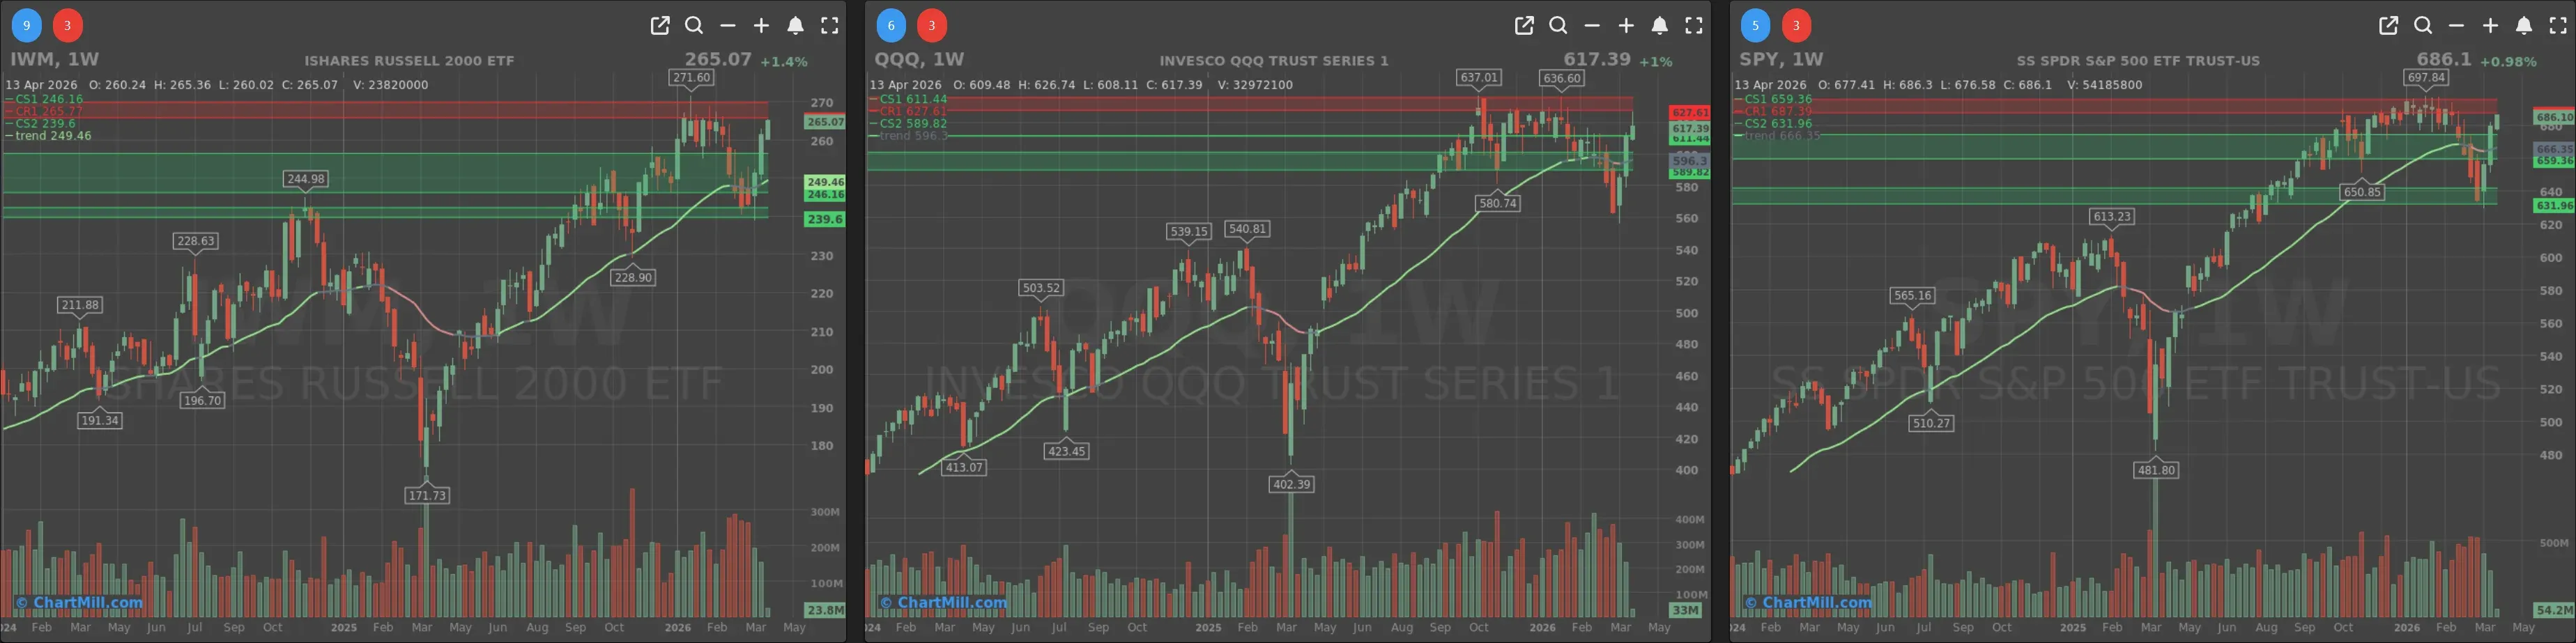
Long Term (Weekly)
SPY added another strong session and continued the rebound off the late-March washout low. On the daily chart, price extended further above the short-term moving averages and pushed back toward the lower edge of the overhead resistance band.
On the weekly chart, SPY is now again trading well above its long-term trend gauge, which tells you the panic phase has cooled considerably. Still, price is rallying back into an area where supply previously appeared, so this remains a repair process.
QQQ also kept improving and arguably delivered the cleanest continuation signal of the three major ETFs. The daily chart shows a steady recovery from the recent low, with price now clearly back above the short-term averages and approaching the next resistance zone. On the weekly chart, QQQ is also back above its long-term trend level, but like SPY it is now pressing into an overhead area where sellers may reappear.
IWM remained the relative standout. Small caps gained the most again and are now pressing directly into the upper resistance area on the daily chart. On the weekly chart, IWM still looks the healthiest of the three from a trend perspective, with price well above its long-term trend line.
Breadth summary
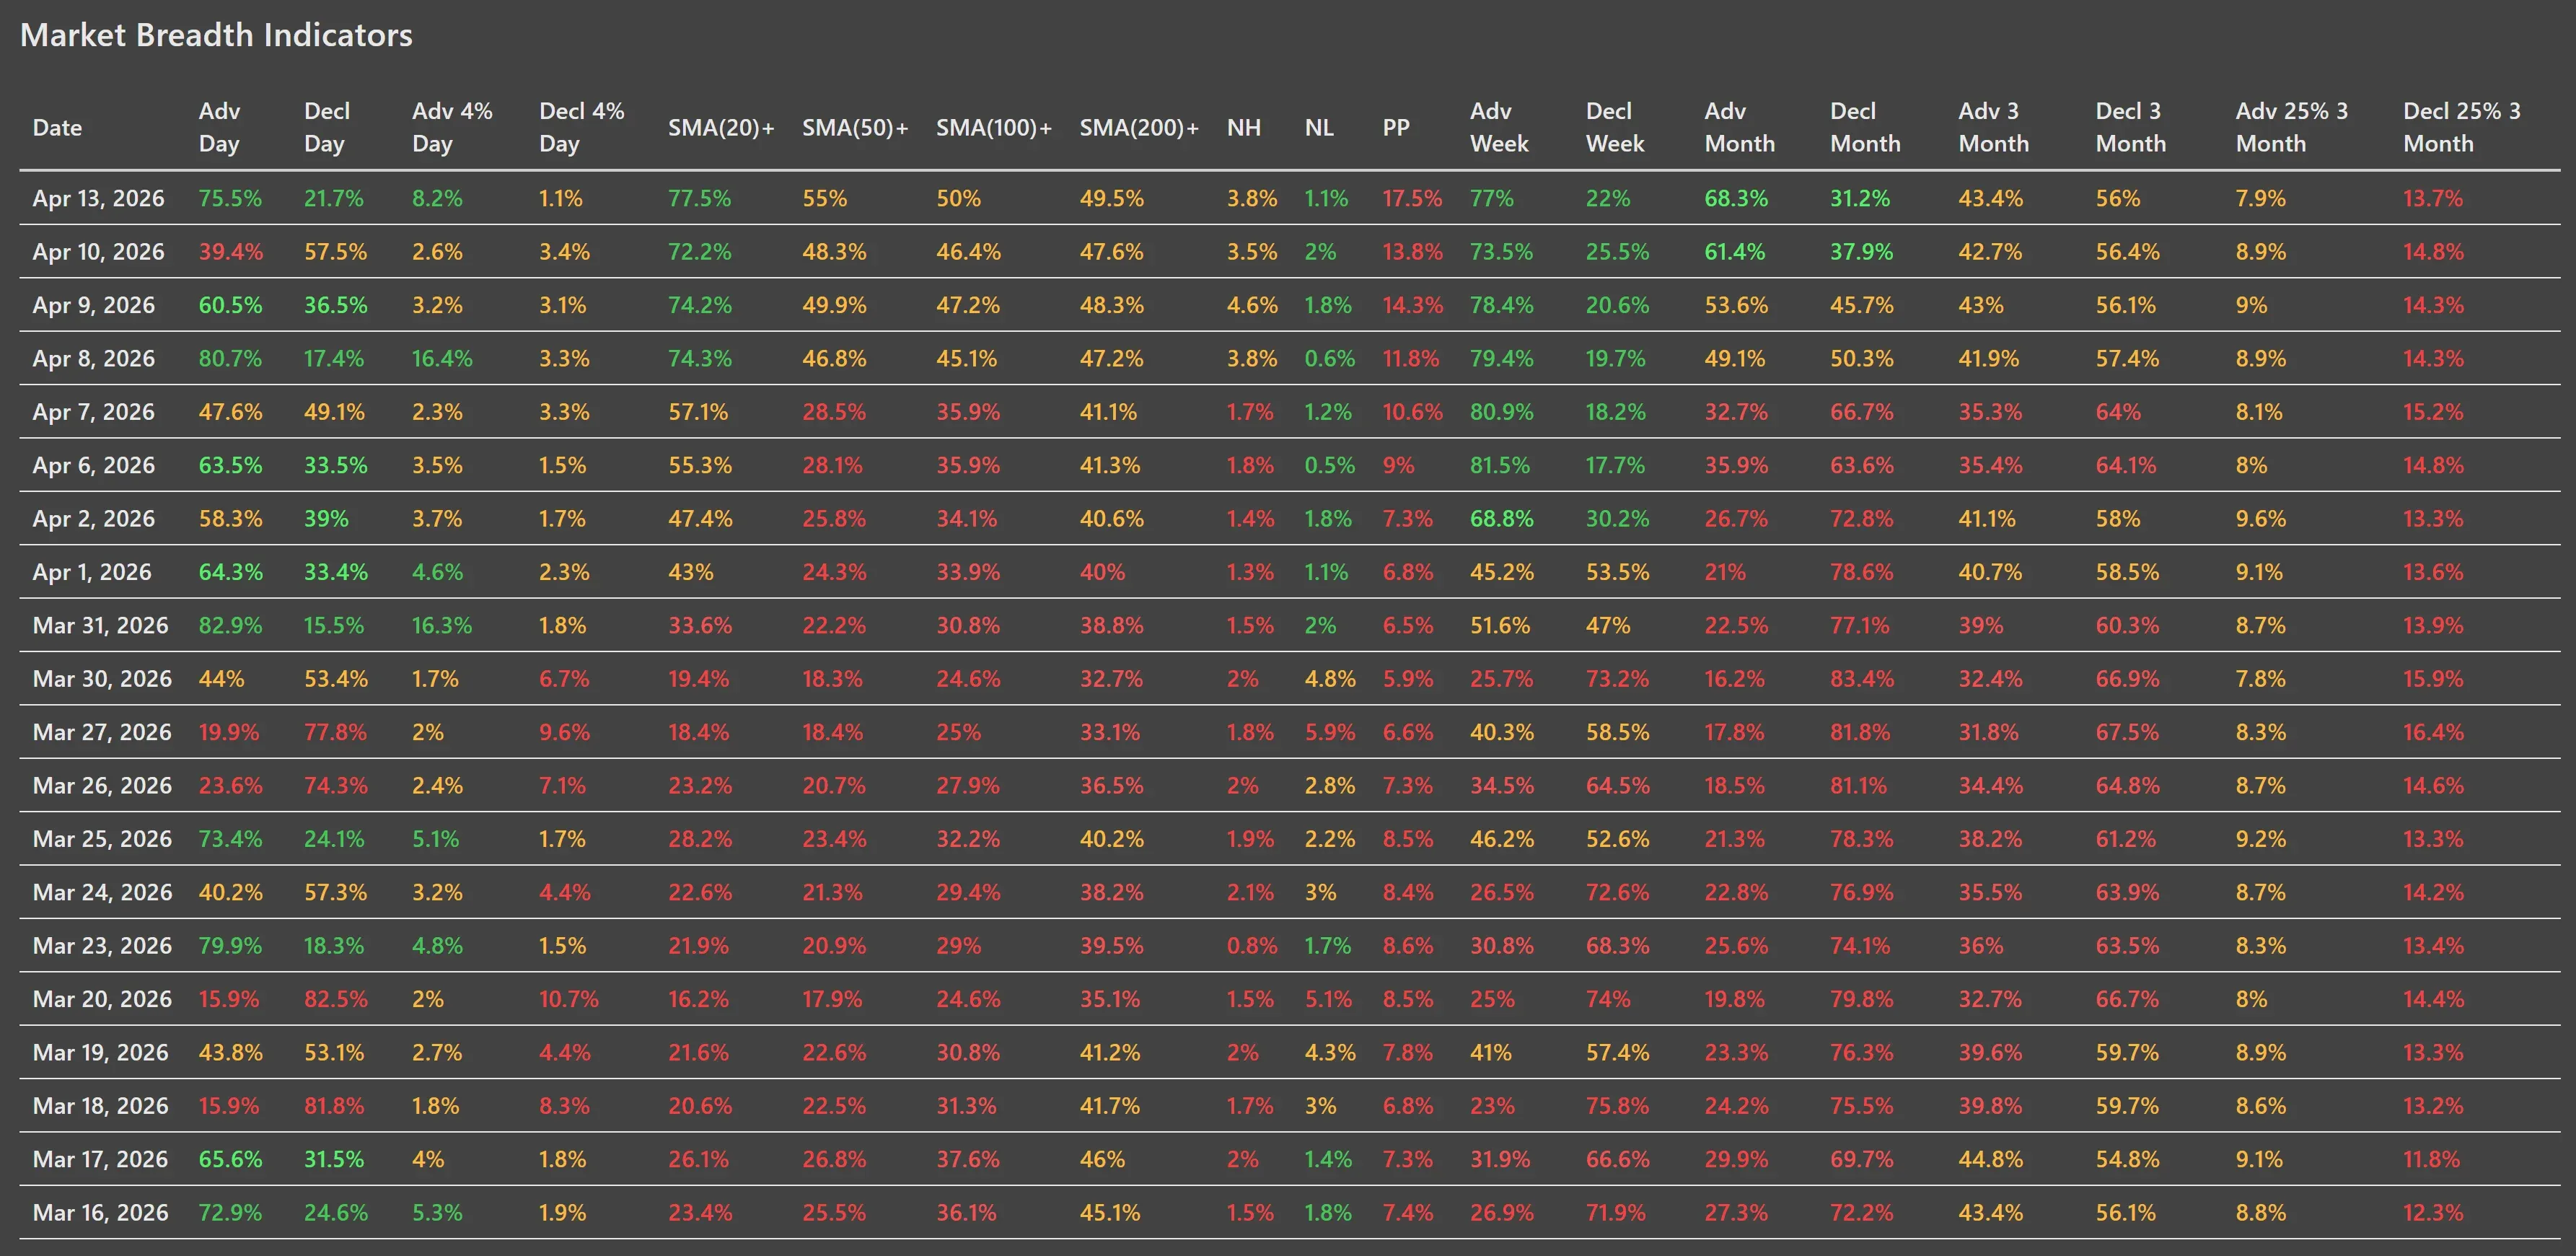
Daily advancers jumped to 75.5% from 39.4% on the previous session, while daily decliners dropped to 21.7% from 57.5%. That is a market re-broadening in a meaningful way.
The same message shows up in the trend participation data:
- SMA(20)+ rose to 77.5% from 72.2%
- SMA(50)+ improved to 55.0% from 48.3%
- SMA(100)+ rose to 50.0% from 46.4%
- SMA(200)+ climbed to 49.5% from 47.6%
Short-term breadth remains strong, intermediate-term breadth has now moved back above a more convincing threshold, and long-term breadth is getting very close to the important 50% line. The rebound is spreading deeper into the market’s structure.
The most important breadth message
The best part of Monday’s report is not just that breadth was green again. It is where the improvement occurred.
The market is now showing strength in:
- daily, weekly and monthly participation
- and the percentage of stocks reclaiming key moving averages
- Advancing week rose to 77.0%, while declining week fell to 22.0%
- Advancing month improved to 68.3%, versus 31.2% declining month
This fits very well with the tone of Monday’s market news. Despite a geopolitical shock and a sharp oil spike, the market did not retreat into narrow defensiveness. Instead, investors were willing to rotate back into risk, especially software and other growth-sensitive areas. That kind of behavior typically supports breadth expansion rather than breadth contraction.
New highs, new lows, and participation thrust
The new highs/new lows data also improved.
- New highs came in at 3.8%
- New lows dropped to 1.1%
New highs now outnumber new lows by a comfortable margin, which supports the idea that internal pressure is shifting away from defense and back toward accumulation.
The Pocket Pivot reading rose to 17.5%, up from 13.8% on Friday and from just 5.9% on March 30. That is one of the clearest signs in the table that the market has moved from stabilization into genuine repair. More stocks are participating in thrust-like behavior instead of simply bouncing from oversold conditions.
What still needs work
The main reason is that the longer-horizon damage has not been fully erased. The weakest section of the table is still the three-month view:
- Adv 3 Month: 43.4%
- Decl 3 Month: 56.0%
- Adv 25% 3 Month: 7.9%
- Decl 25% 3 Month: 13.7%
So yes, the market has improved dramatically over the past two weeks. But over the broader three-month window, more stocks are still in declining trends than advancing ones, and more stocks remain significantly below prior highs than significantly above them.
Reading the tape in context
The market’s behavior on Monday was psychologically important. The news backdrop was uncomfortable, yet the market treated the oil spike as manageable rather than destabilizing. The report notes that investors appeared to believe the Iran situation would remain temporary noise rather than turn into a lasting macro shock, while software staged a notable relief rally after prolonged weakness.
That type of backdrop often produces one of two outcomes. Either the rally narrows because investors hide in a few defensives, or participation expands because the market interprets the shock as survivable. Monday clearly fell into the second camp.
That does not mean risk has disappeared. It does mean the market is currently choosing resilience over fear.
Bottom line
The index charts remain in rebound mode, with SPY and QQQ pushing back into resistance and IWM continuing to lead. Internally, breadth broadened sharply again, moving average participation improved across all major timeframes, and new highs continued to outpace new lows. That is the kind of follow-through you want to see if you are trying to distinguish a real internal repair from a temporary oversold bounce.
The bigger picture is not fully healed yet. The three-month data still shows residual damage, and the major ETFs are now moving into zones where supply could reappear. But as of Monday’s close, the burden of proof has shifted further away from the bears.
Breadth trend rating: 6 out of 7 — Positive
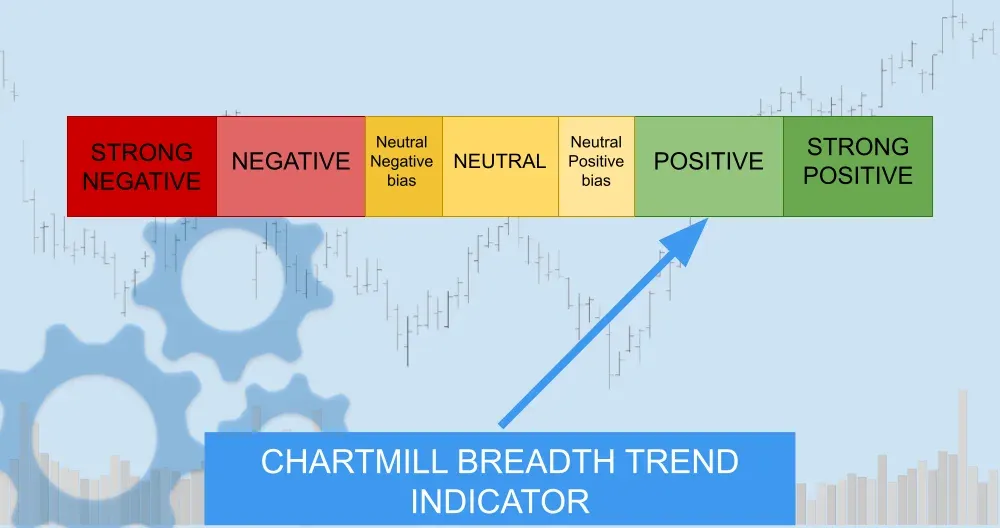
That rating reflects strong short- and intermediate-term participation, improving long-term internals, and leadership broadening beyond just the largest names.
ChartMill Market Desk
This daily Market Breadth Report is prepared by ChartMill for informational purposes only and does not constitute investment advice. Always do your own due diligence before making investment decisions.
Next to read: Wall Street Yawns at the Hormuz Blockade Then Buys Software