Tuesday’s session kept the recent repair phase alive and, in several areas, strengthened it. Breadth improved again, short-term participation stayed strong, and the major index ETFs pressed into important resistance zones.
Index Overview (SPY, QQQ, IWM)
Short Term (Daily)
Long Term (Weekly)

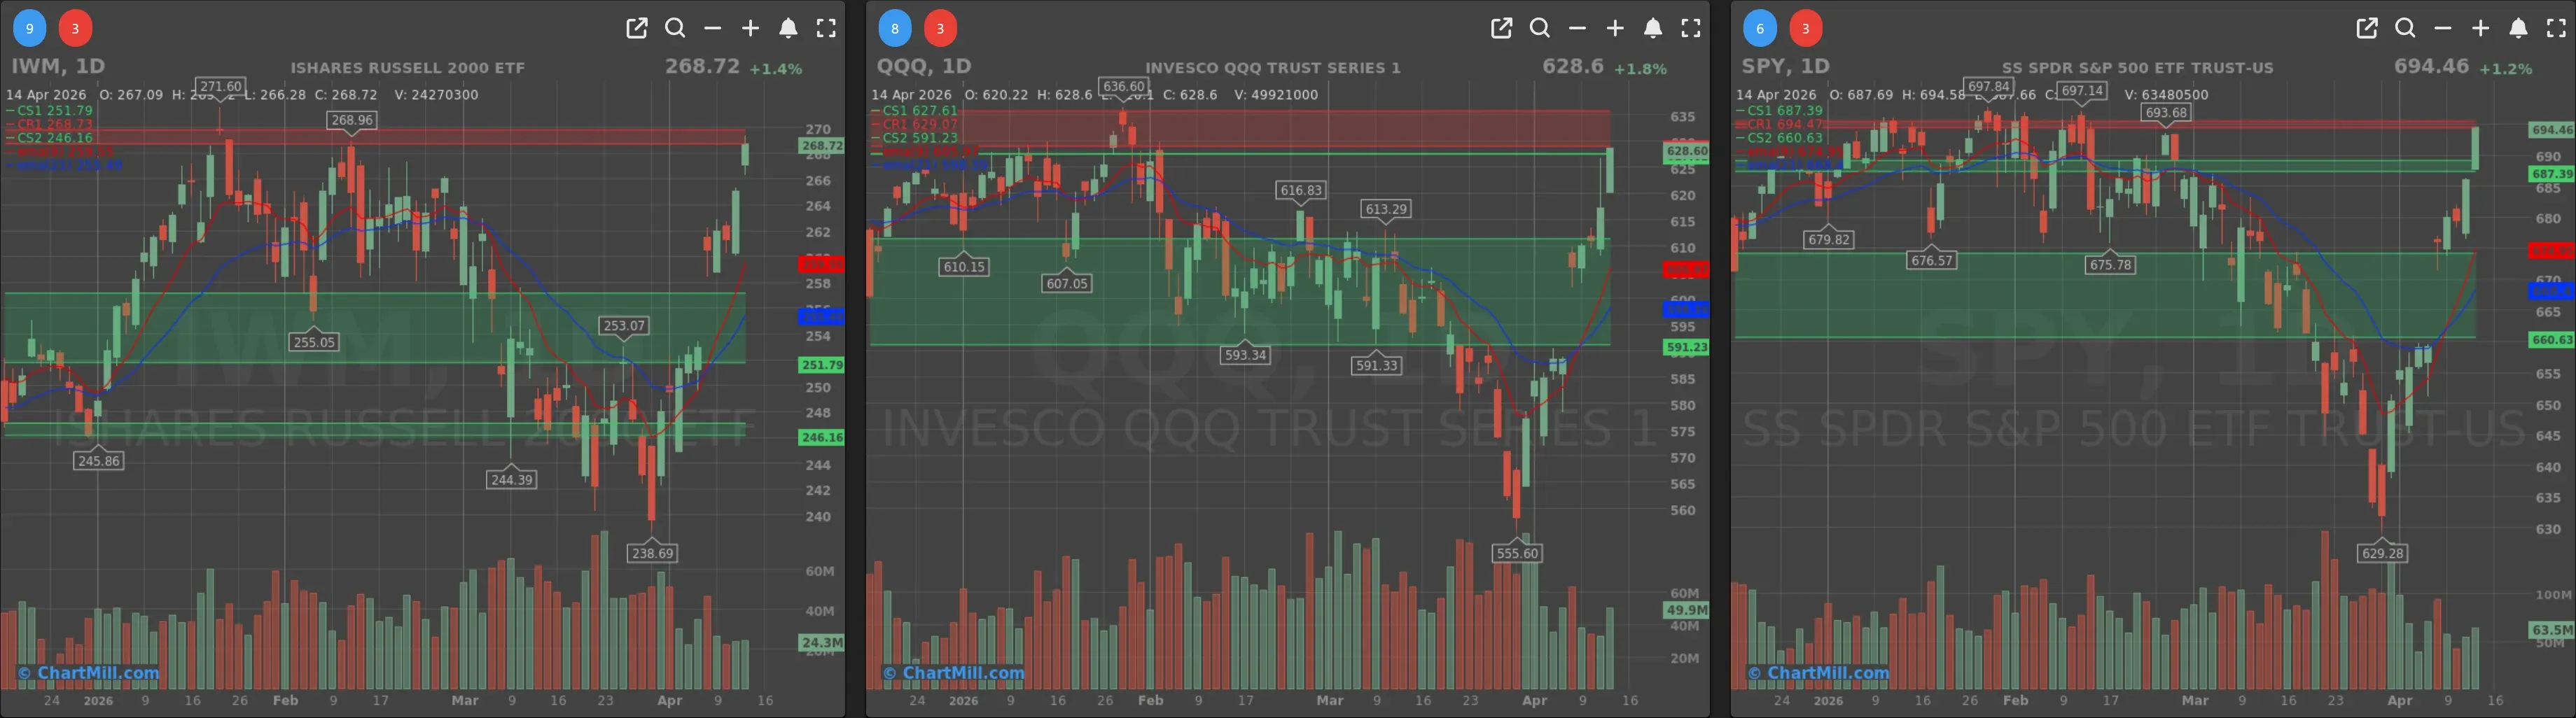
SPY closed at $694.46, up 1.2%, and is now pressing right into the upper resistance band around the prior highs. On the daily chart, price extended further above both the 9-day and 21-day EMA, which confirms that the short-term trend remains firmly positive. The move is now mature enough that the question is no longer whether buyers regained control in the short term. They did. The question is whether the market can now convert that momentum into a clean breakout through overhead supply.
On the weekly chart, SPY remains above its long-term trend zone, and the pullback from the recent sharp selloff now looks increasingly like a successful test of the broader uptrend rather than the start of a larger structural breakdown.
QQQ was even stronger, gaining 1.8% to $628.6. That puts it back into the upper resistance region as well, not far below the prior peak area around the mid-630s. The daily chart shows a very strong rebound sequence from the early-April low near 555.6. Price has clearly reclaimed both short-term moving averages, and the slope of that recovery remains impressive. Compared with Monday, this was another step higher in the same direction: leadership remains intact, and tech-heavy growth names are still helping carry sentiment.
On the weekly chart, QQQ is also stabilizing well above its deeper support area. The weekly trend backdrop remains constructive, though this ETF still has the clearest overhead resistance challenge of the three.
IWM added 1.4% to $268.72 and, in some ways, told the most encouraging breadth story of the day. Small caps are now challenging their own overhead resistance band after a sharp rebound from the late-March / early-April washout. The daily chart shows a convincing recovery above the 9-day and 21-day EMA, and unlike earlier in the correction, small caps are no longer clearly lagging.
On the weekly chart, IWM remains somewhat more volatile than SPY, but the bigger picture has improved clearly. Price is holding above long-term trend support and has rebounded strongly from the 246 area.
Most importantly, since the beginning of the week, the ChartMill Trend Indicator has shifted from neutral to positive, which is a meaningful improvement in the longer-term backdrop for small caps. Tuesday’s move reinforces the idea that small caps are not merely participating in the rebound, but are starting to regain stronger technical footing of their own.
Breadth summary
Tuesday’s breadth data was strong enough to keep the market in the “improving internals” camp.
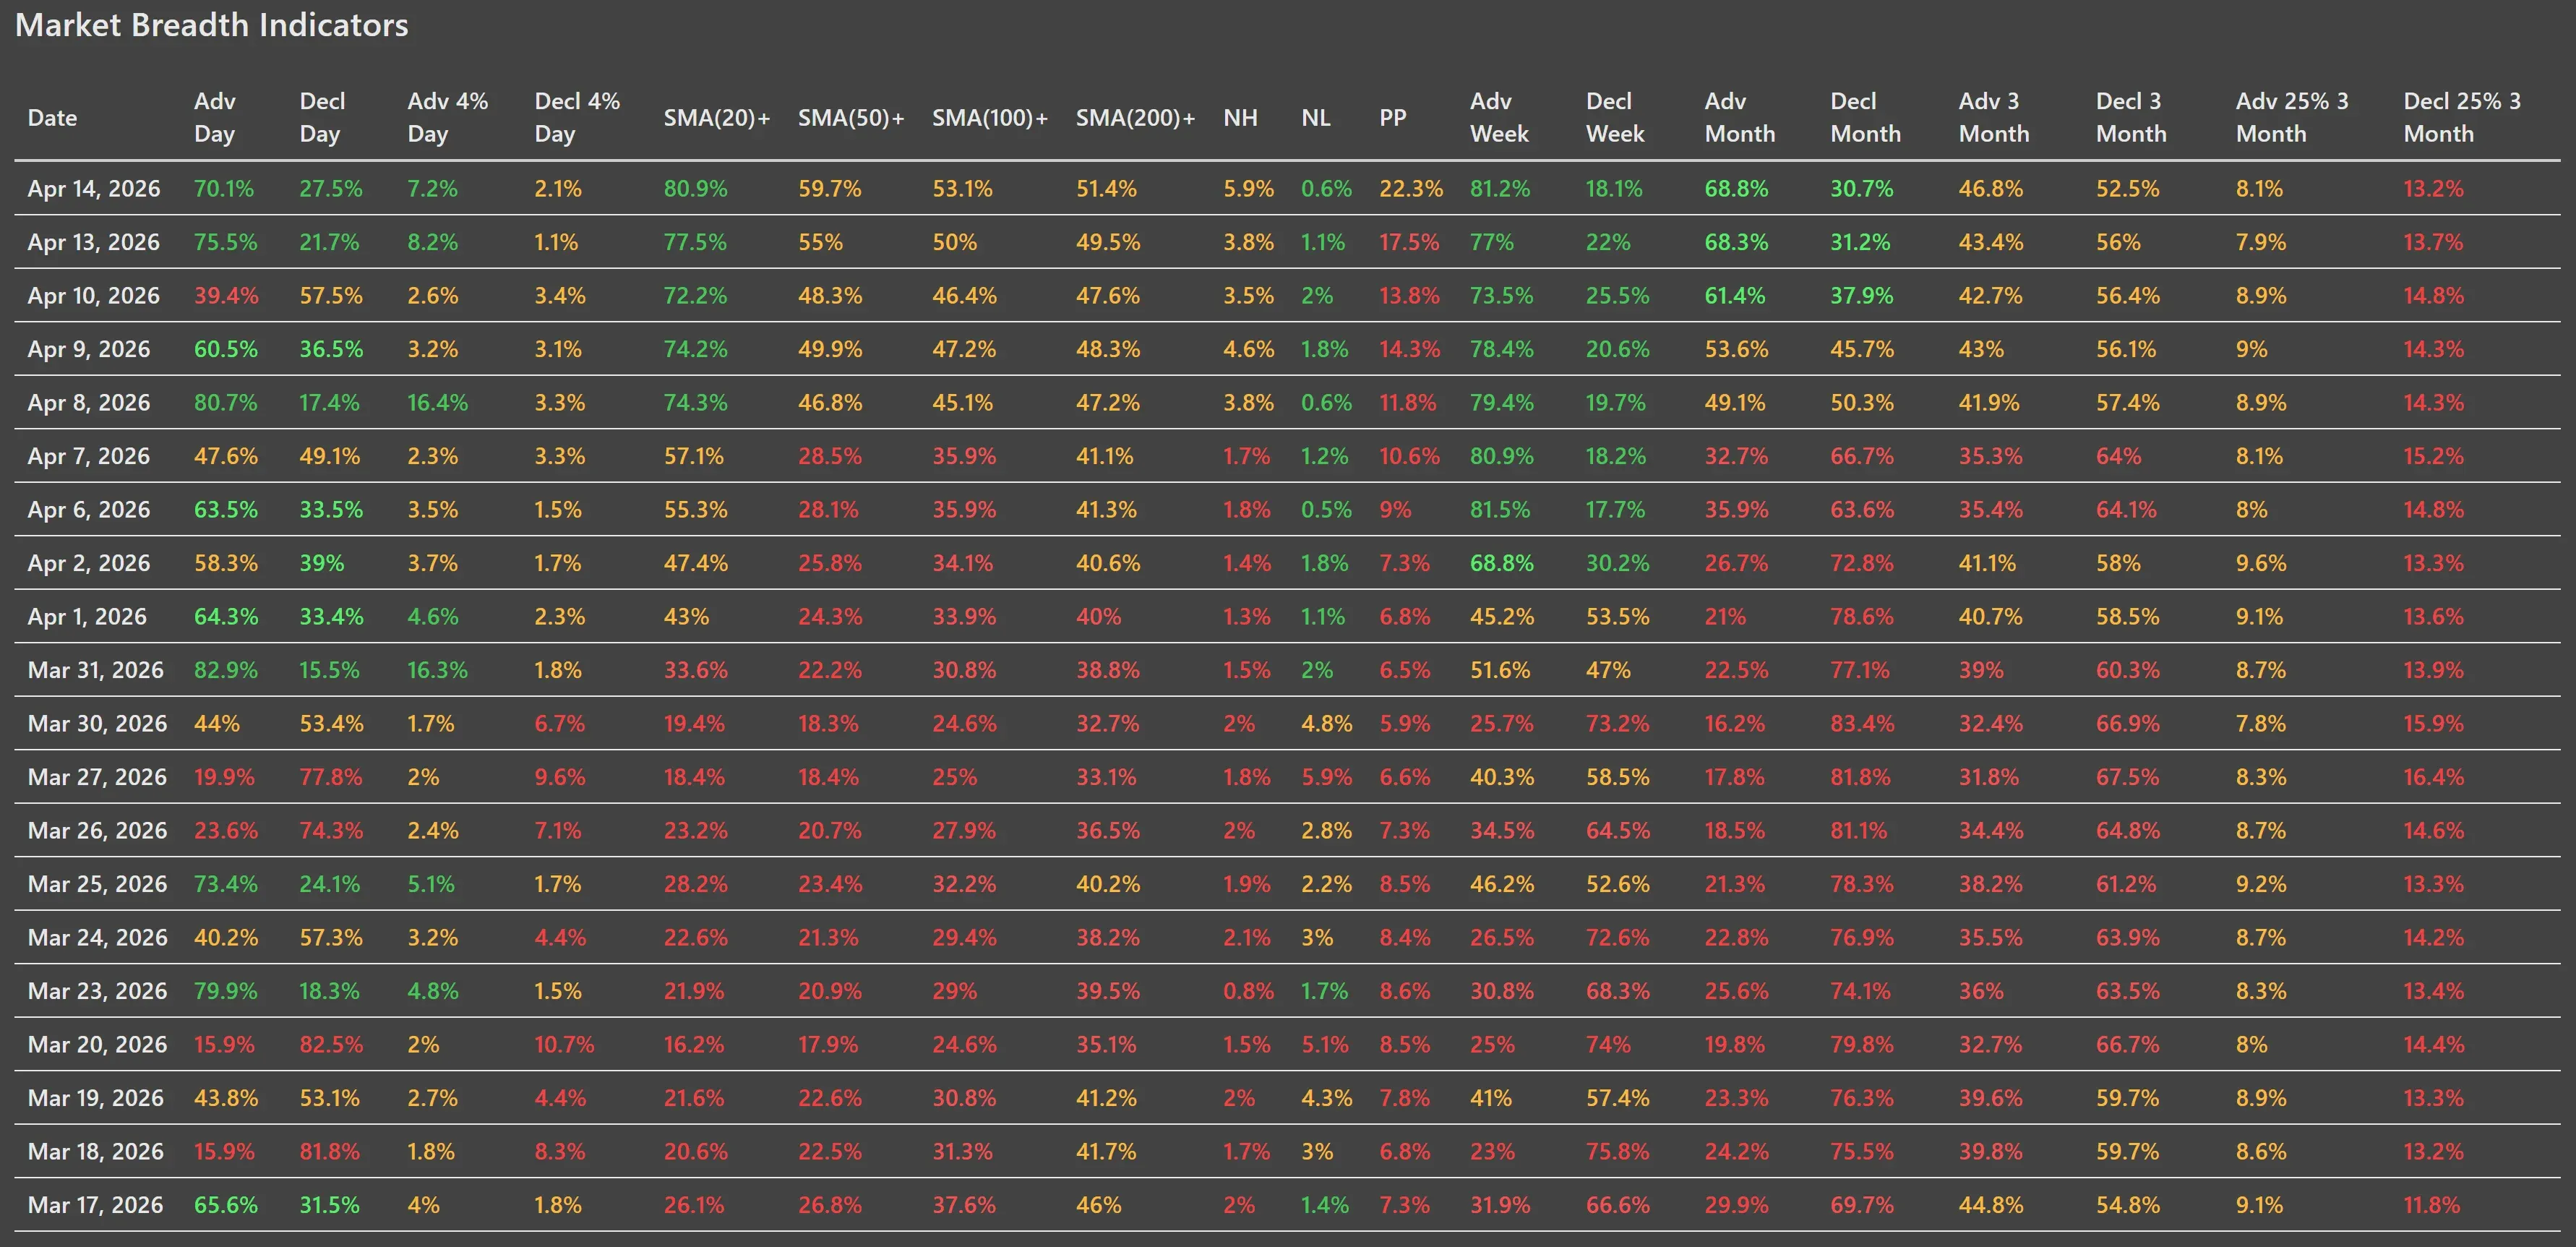
Advancers finished at 70.1%, while decliners came in at 27.5%. That is a healthy breadth day. It was slightly less explosive than Monday’s 75.5% advancing issues, but still clearly positive. It shows that Monday’s strong participation was not a one-day event that immediately faded. Breadth remained broadly supportive.
Even more telling, 7.2% of stocks gained more than 4%, versus 2.1% declining more than 4%. It suggests momentum remains present, but is normalizing rather than becoming euphoric.
The most important improvement came from trend participation:
- SMA(20)+: 80.9%
- SMA(50)+: 59.7%
- SMA(100)+: 53.1%
- SMA(200)+: 51.4%
These numbers are very constructive.
The key point is not just that these figures rose. It is that the market is now moving beyond a short-term oversold rebound and into broader trend repair. Monday already hinted at that, with 77.5% of stocks above the 20-day and 55% above the 50-day average. Tuesday improved those readings again. The move above 50% for both the 100-day and 200-day measures is especially important, because it tells us that participation is no longer confined to the fastest-moving names. More than half the market has now regained intermediate and long-term trend footing.
On March 31, only 33.6% of stocks were above the 20-day average, 22.2% above the 50-day, 30.8% above the 100-day, and 38.8% above the 200-day. The contrast is stark. This is a real breadth repair.
New highs and new lows remained benign:
- NH: 5.9%
- NL: 0.6%
Another sign that internal selling pressure has largely cooled off for now. Tuesday’s new low reading dropped back down from Monday’s 1.1%, while new highs improved from 3.8% to 5.9%. That is exactly the direction bulls want to see when a market approaches resistance: fewer fresh breakdowns, more stocks asserting leadership.
The Pocket Pivots reading rose to 22.3%, up from 17.5% Monday. That is another quiet but useful sign that more stocks are setting up in constructive patterns instead of merely bouncing off lows.
Broader Participation Across Timeframes
The multi-timeframe breadth picture continues to improve.
Weekly breadth was again strong:
- Adv Week: 81.2%
- Decl Week: 18.1%
These numbers tell us the recent advance is not just a daily swing phenomenon. Across the past week, the market has been broadly tilted to the upside.
Monthly breadth also improved further:
- Adv Month: 68.8%
- Decl Month: 30.7%
This is notable because only a few sessions ago the monthly structure was still negative. Now it has flipped decisively toward the advancing side. That is another sign the market has moved out of a simple reflex bounce and into something more durable.
The 3-month data is still the one area that has not fully healed:
- Adv 3 Month: 46.8%
- Decl 3 Month: 52.5%
That remains slightly negative, though clearly better than the deeply weak readings seen in late March. This is actually a healthy reminder not to overstate the bullish case. The market has repaired a lot of damage quickly, but the longer swing window has not fully turned yet.
What Changed Versus the Previous Trading Day?
Compared with Monday, Tuesday offered confirmation more than surprise.
Monday’s message was that breadth was accelerating and that the recovery was broadening beyond a few large-cap leaders. Tuesday supported that thesis in three important ways.
-
First, trend participation improved again, especially on the 50-day, 100-day, and 200-day readings. That is a major positive because it shows continued internal follow-through.
-
Second, new highs expanded while new lows remained muted. That keeps the market in a constructive internal regime.
-
Third, small caps stayed involved. Breadth rallies tend to be more durable when participation widens beyond the mega-cap complex.
What did not change is just as important: the market still has to deal with resistance. SPY and QQQ are both pressing into overhead supply zones. IWM is doing the same. So while internals keep improving, price is now entering the area where bullish momentum has to prove it can survive contact with prior sellers.
News Context
The news backdrop helps explain why Tuesday’s breadth stayed so strong, but it does not replace the underlying technical message.
The main themes were a sharp drop in oil prices on perceived progress in U.S.-Iran talks, softer-than-expected PPI data, strong bank earnings, and another burst of enthusiasm around AI and quantum-related names after Nvidia’s product launch. That combination clearly supported risk appetite during the session.
That context fits the tape.
Lower oil and cooler inflation data helped the market lean further into the “risk-on but with less macro pressure” narrative, while earnings and AI leadership gave investors enough reason to keep buying strength.
At the same time, the news report also highlighted a more cautious undertone beneath the surface, including Jamie Dimon’s pointed risk comments and renewed attention on private credit exposure. That matches the chart setup quite well: this is an improving market, but one now pushing into levels where friction is normal.
Bottom Line
Tuesday’s breadth data was not as dramatic as the most explosive thrust sessions earlier in the rebound, but in some ways it was more important. It showed follow-through.
The market now has:
- strong daily participation,
- improving intermediate and long-term trend breadth,
- a healthy weekly backdrop,
- low new-low pressure,
- and continued confirmation from all three major index ETFs.
That is the profile of a market that is repairing itself effectively.
The caution is also clear. Price is now close enough to major resistance that breadth alone is not enough. The next step has to come from the indexes themselves. A clean breakout would validate what breadth has been saying for days. A stall or rejection would not erase the progress, but it would remind us that recovery and breakout are not the same thing.
For now, the data still leans constructive.
Breadth Trend Rating: 6. Positive
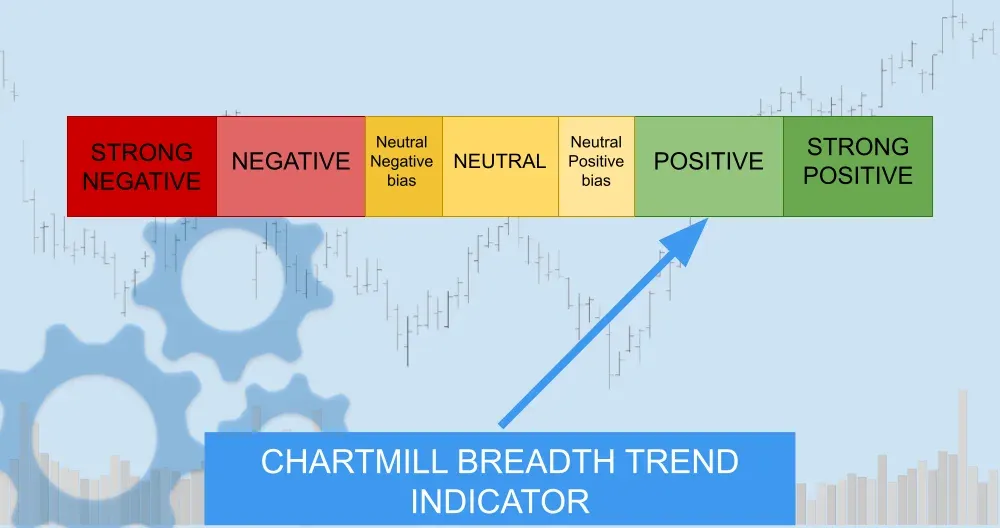
The breadth trend remains positive and improved further on Tuesday.
Participation broadened again, leadership remained constructive, and small caps continued to strengthen. A move to 7 - 'very positive' would require a clearer breakout above resistance and further improvement in the longer-term breadth measures.
ChartMill Market Desk
This daily Market Breadth Report is prepared by ChartMill for informational purposes only and does not constitute investment advice. Always do your own due diligence before making investment decisions.
Next to read: Oil Drops, Dimon Warns, and the Record Is Within Reach