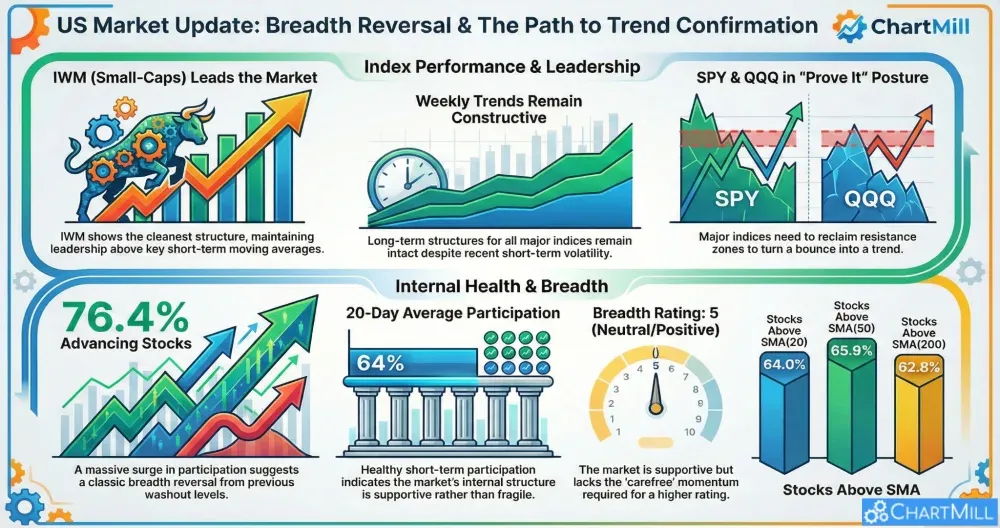
After Tuesday’s lopsided decline, breadth snapped back sharply on Wednesday. Small-caps continued to lead, and the “stocks above key moving averages” cluster remains supportive. Still, the rebound looks more like a strong counterpunch than a confirmed re-acceleration—short-term index charts are improving, but SPY/QQQ still need to reclaim their near-term moving averages decisively to reduce whipsaw risk.
Index overview (SPY, QQQ, IWM)
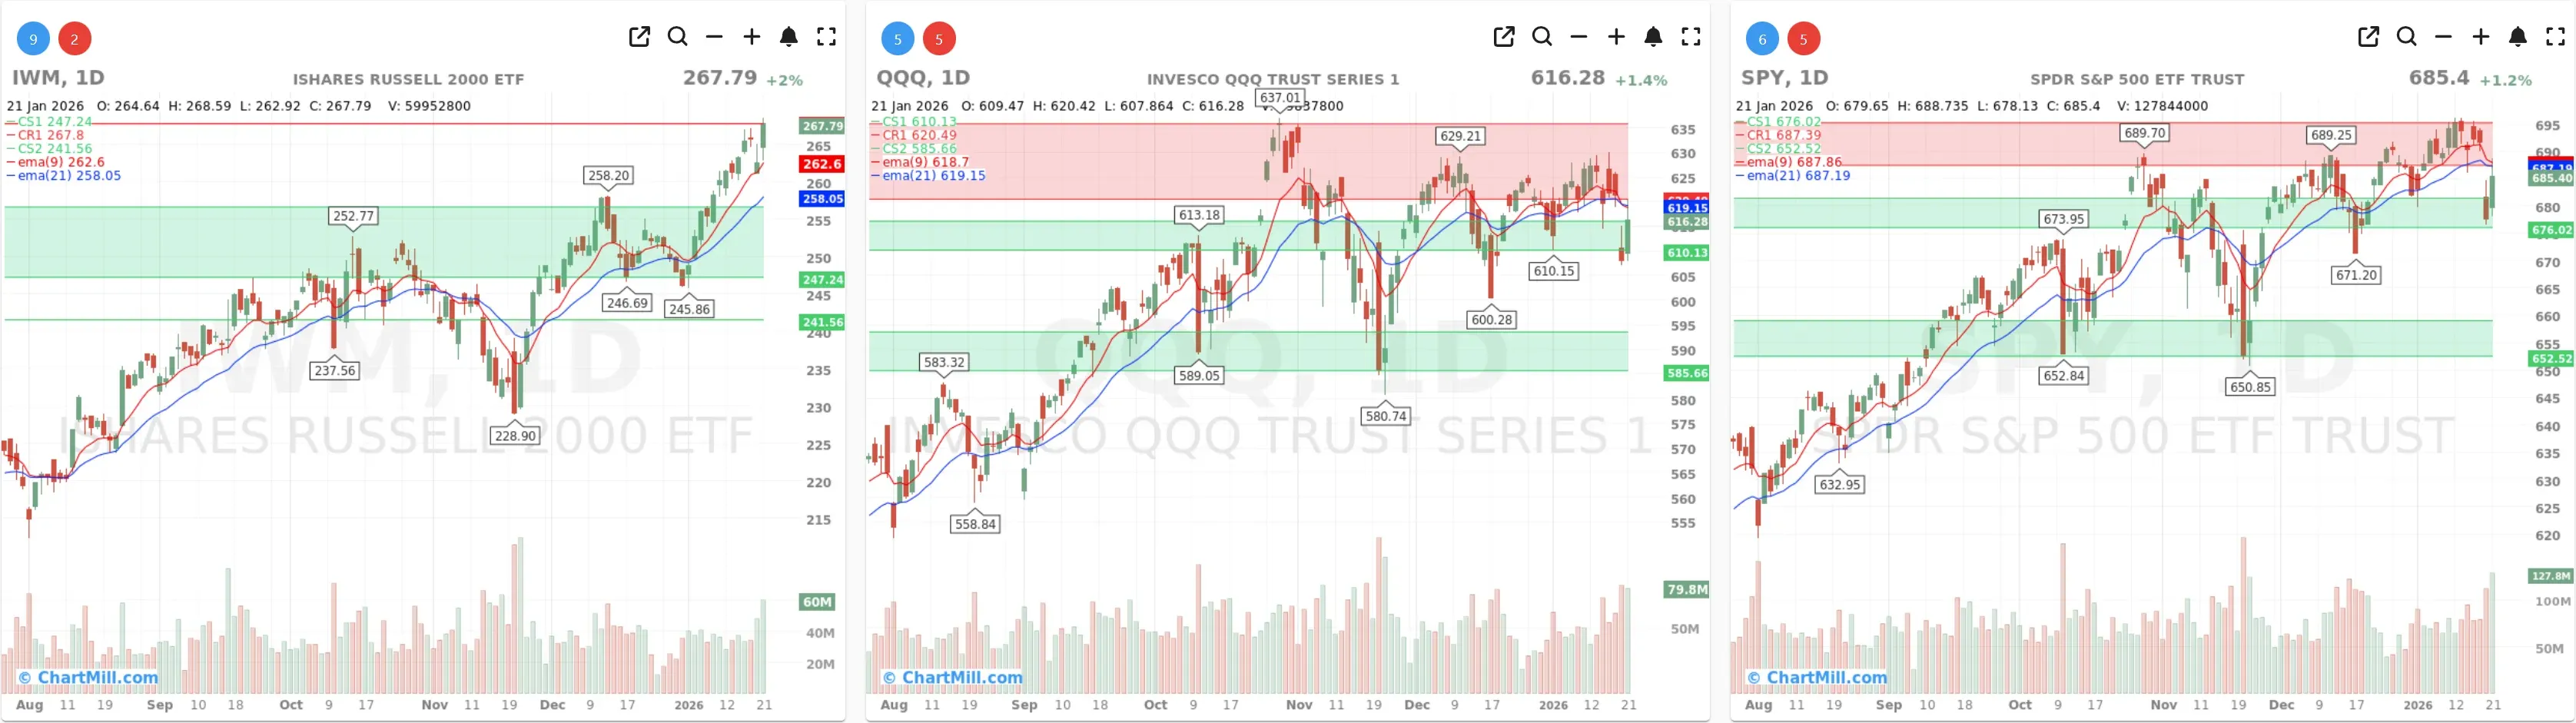
Short Term (Daily)
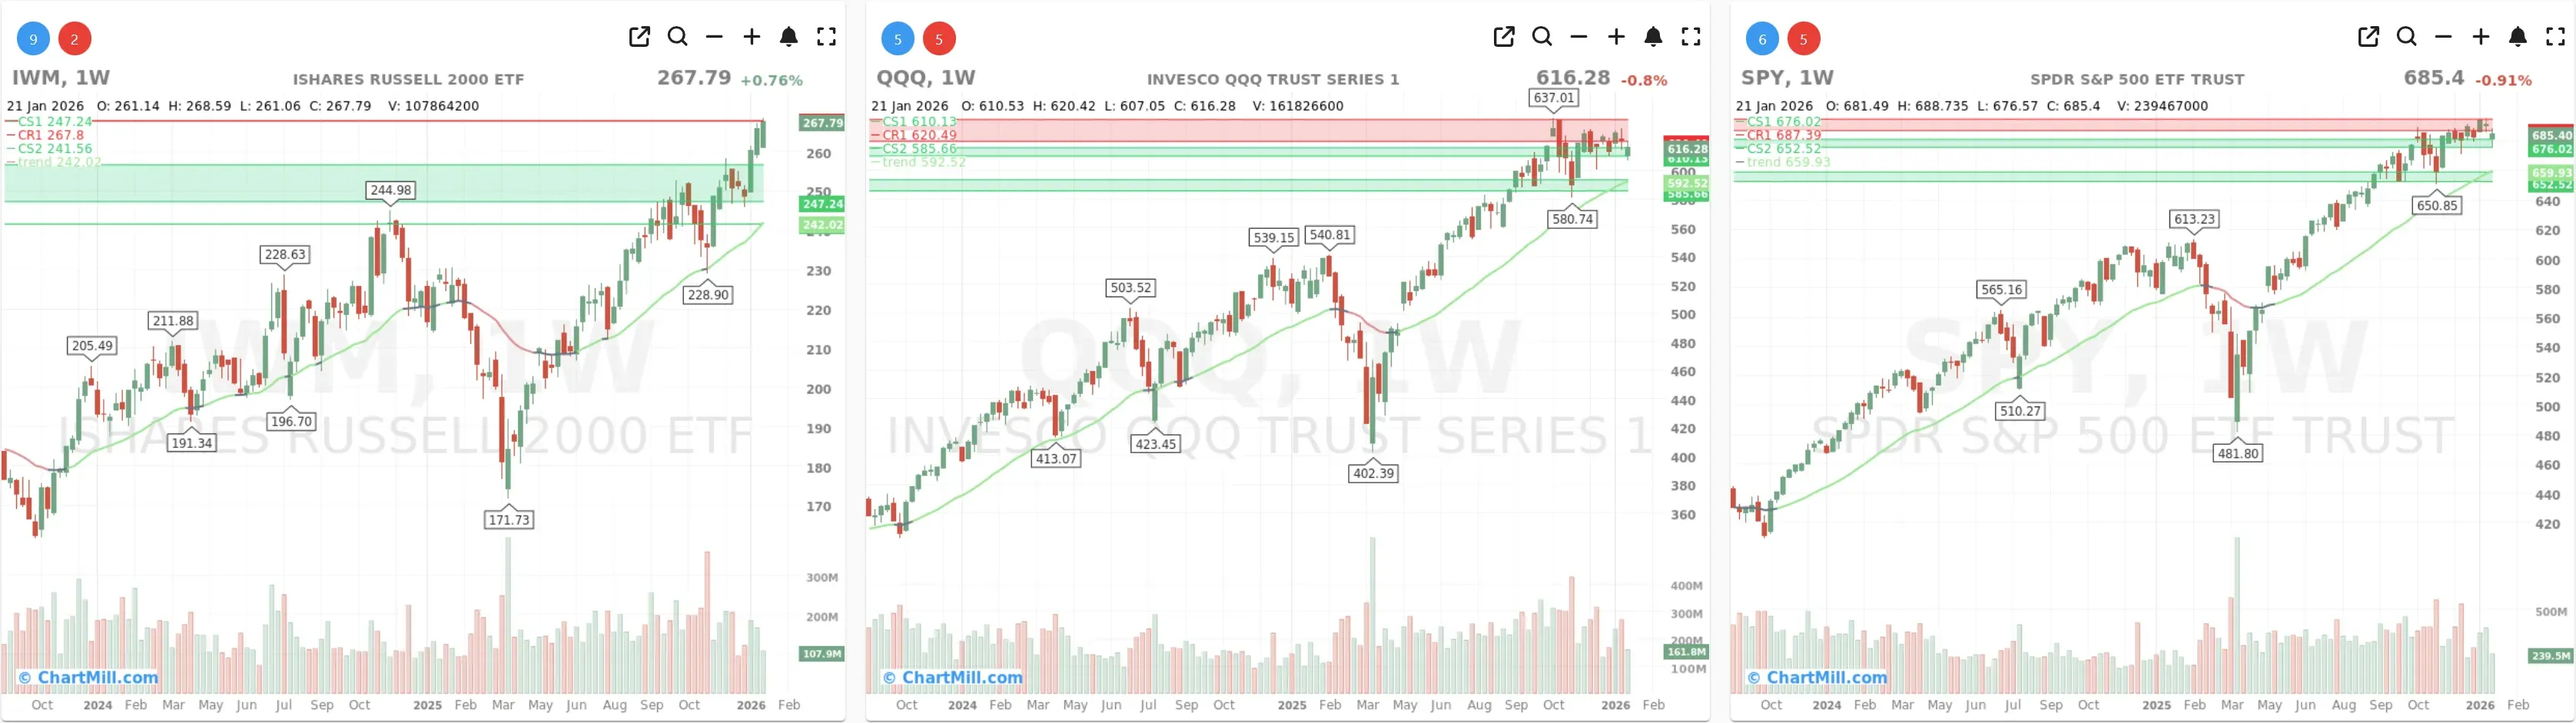
Long Term (Weekly)
SPY
Daily: Strong rebound day, but price is still fighting around the EMA9/EMA21 area. That’s consistent with a market that’s trying to stabilize after a pullback, not one that’s already back in clean “trend mode.”
Levels to watch: The prior highs/resistance zone just above current price remains the next upside test, while the recent pullback low zone is the key “must-hold” support if this bounce is to mature into a renewed leg higher.
Weekly: Trend remains constructive (rising long-term structure). The weekly uptrend is intact, and the recent dip is still best described as a pullback within an uptrend, not a breakdown.
QQQ
Daily: Rebounded, but still slightly below/around the short-term averages, and the chart is clearly trading beneath an overhead resistance zone (the prior supply area). This keeps QQQ in a “prove it” posture: stabilization is happening, but confirmation requires follow-through.
Weekly: Long-term trend remains positive/constructive. The current area is more consistent with consolidation near highs than outright distribution, but the lack of immediate upside traction keeps it neutral-to-positive rather than outright bullish.
IWM
Daily: The standout again. IWM closed back near the highs and remains above EMA9/EMA21, confirming small-cap leadership. That’s an important risk-on tell, especially coming right after a weak breadth day.
Weekly: Strong uptrend posture with price pressing into/through prior resistance zones. This is the cleanest of the three index structures right now—leadership remains small-caps.
Takeaway from the index complex: Wednesday improved the tone across the board, but the market remains split: IWM looks trend-healthy, while SPY/QQQ still need a bit more work to turn this from “bounce” into “resume uptrend.”
Breadth dashboard: a sharp reversal vs. Jan 20
Advancers/decliners: from washout to thrust
-
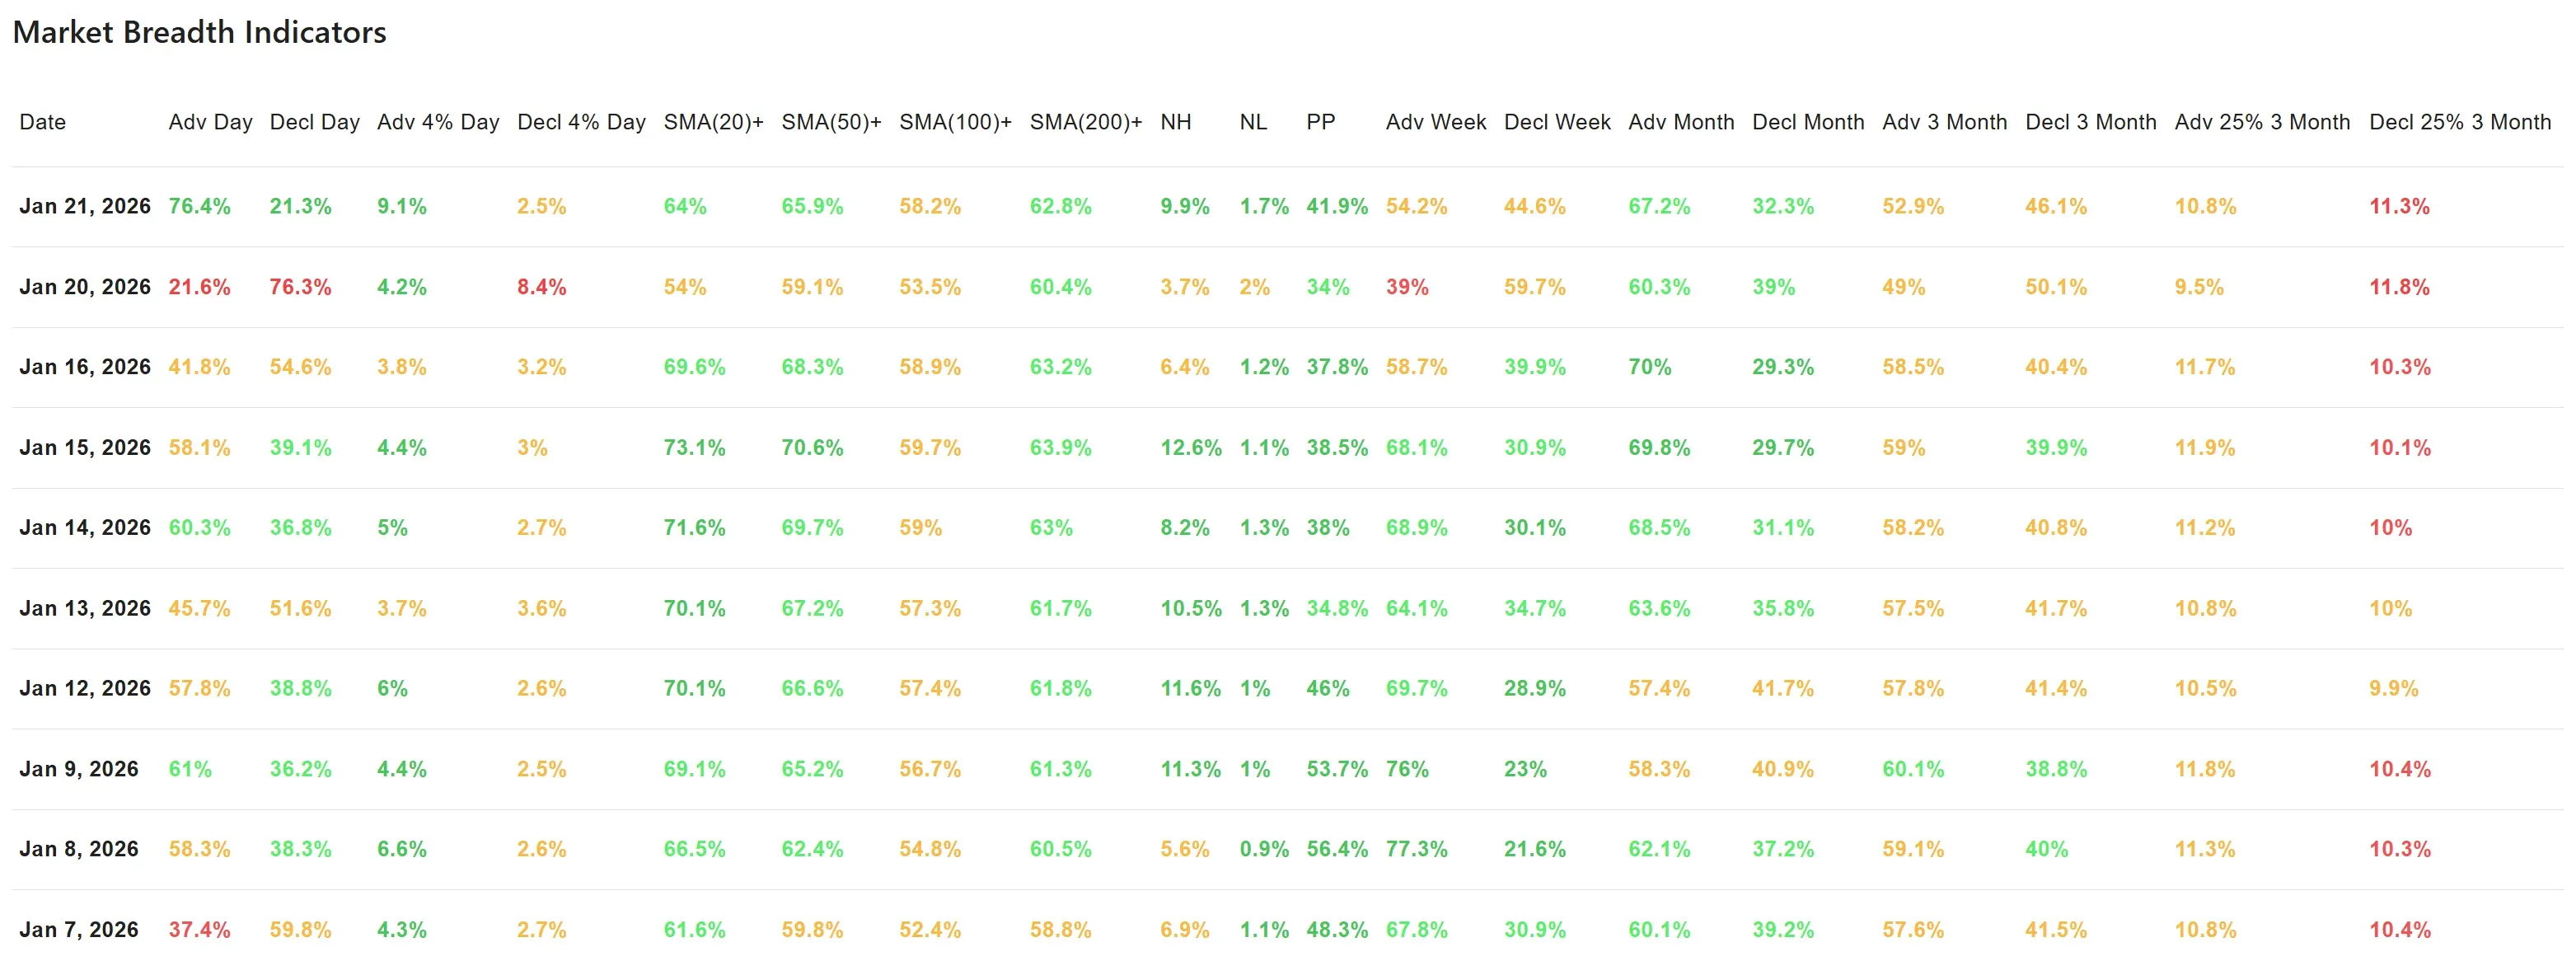
Advancing stocks surged to 76.4% (from 21.6% the prior session), while decliners dropped to 21.3% (from 76.3%).
-
That’s a classic breadth reversal: not just an index bounce, but a session where participation swings back in favor of bulls.
“Power movers” (±4%): risk appetite improved
-
Advancing +4% names rose to 9.1%, while declining -4% names fell to 2.5%.
-
This matters because it suggests less forced selling and more aggressive buying compared to Tuesday’s tone.
Stocks above key moving averages: supportive, but not uniform
-
Above SMA(20): 64% (healthy short-term participation)
-
Above SMA(50): 65.9% (healthy intermediate participation)
-
Above SMA(100): 58.2% (good, but less robust)
-
Above SMA(200): 62.8% (still constructive longer-term)
This cluster says the market’s internal structure remains more supportive than fragile, even though the last two sessions show clear short-term volatility.
New highs/new lows: improving but not “clean”
- New highs: 9.9% vs new lows: 1.7%
That’s positive, but a market in a strong, steady advance often shows a more persistent expansion in highs over multiple sessions. Today is a good reading—the key is whether it persists.
Participation (PP): still not euphoric
- Pockets Pivots improved to 41.9% (from 34%).
Better, but not the kind of broad, persistent participation number you typically see in the most powerful trend phases. It reinforces the idea: good rebound, not full momentum regime (yet).
Multi-timeframe check: short-term improved, longer-term still mixed
-
Week: Advancers 54.2% vs decliners 44.6% → slightly positive
-
Month: Advancers 67.2% vs decliners 32.3% → clearly positive
-
3 Months: Advancers 52.9% vs decliners 46.1% → still mixed/only mildly positive
-
25% movers (3 Months): Adv 10.8% vs decl 11.3% → essentially balanced, slightly negative
So, the broader backdrop remains constructive (especially the 1-month read), but the 3-month “big movers” data suggests the market isn’t in a uniform runaway trend—rotation and two-sided volatility are still present.
What changed versus the previous breadth update (Jan 20)?
Tuesday looked like a downside participation day (decliners dominated, and the -4% cohort was elevated). Wednesday reversed that nearly point-for-point: advancers, strong movers, and highs all improved, with small-caps continuing to act as the leadership group.
The main difference is that price confirmation is still cleaner in IWM than in SPY/QQQ, which are still working through near-term resistance/average-reclaim dynamics.
Breadth trend rating (1–7)
5 — Neutral, with a positive bias.

The internal structure (SMA breadth + monthly adv/dec) stays supportive and Wednesday’s reversal was strong. But given the sharp whipsaw from Tuesday to Wednesday - and SPY/QQQ still needing clearer trend confirmation - the market is not yet back in a “carefree trend” state.
The next 1–3 sessions will matter: follow-through would likely push this toward 6 (positive), while another quick reversal would pull it back toward 4 (neutral).
Kristoff
Next to read: The Davos Pivot: Trump’s Tariff U-Turn Sends Markets Into a Greenland Glow