U.S. indices held near their highs after Tuesday’s close, with IWM continuing to lead and SPY/QQQ consolidating just beneath resistance. Under the hood, breadth remains solidly constructive (strong SMA participation, very favorable new-high/new-low balance), but the short-term thrust has cooled a bit, suggesting a market that’s still healthy, just not accelerating.
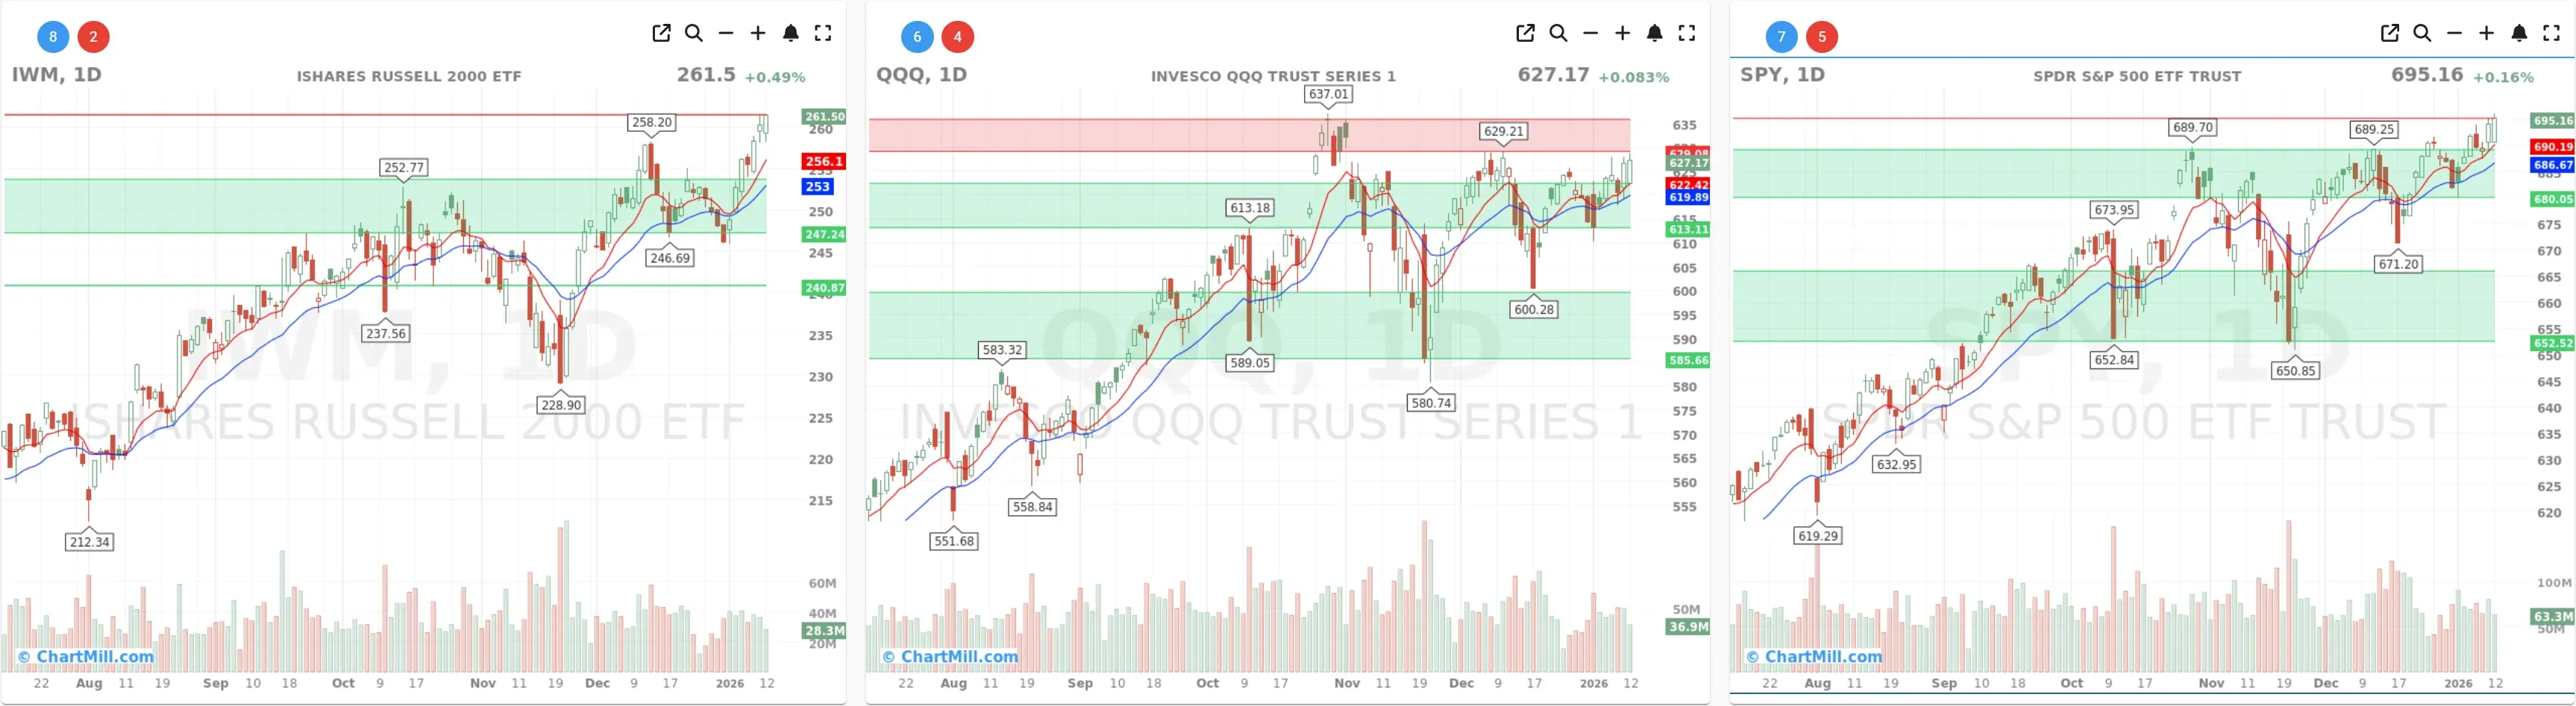
Index overview (SPY, QQQ, IWM)
Short Term (Daily)
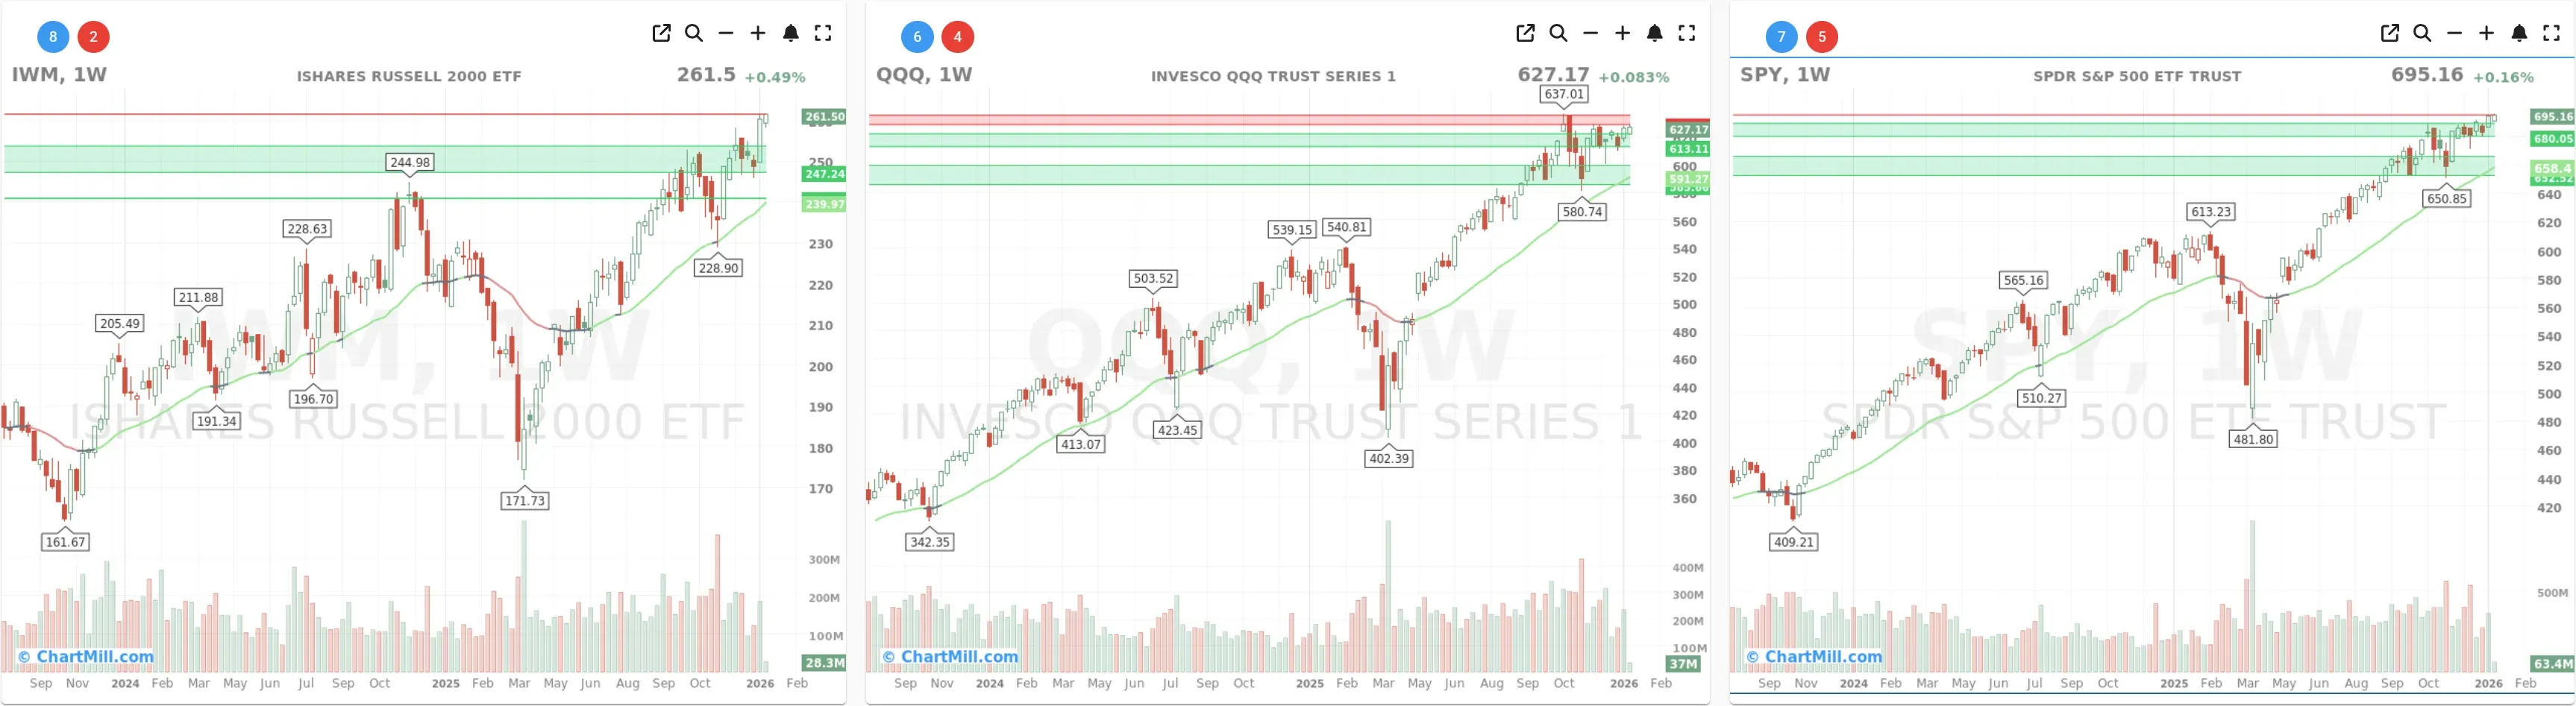
Long Term (Weekly)
SPY
SPY finished marginally higher and continues to grind upward in a tight range near the highs. On the daily chart, price remains above both EMA9 and EMA21, with the moving averages rising and acting as dynamic support. This keeps the short-term trend intact, but the structure also looks like controlled consolidation rather than a fresh momentum push.
On the weekly chart, the longer-term picture remains clearly constructive: price is still trending above the 30-week EMA (Trend Indicator stays green), consistent with an ongoing primary uptrend.
My read: Still bullish structure, but the market is “working off” gains more than expanding aggressively.
QQQ
QQQ remains the most “two-speed” index: strong longer-term trend, but short-term price action is choppy and capped near resistance. The daily chart shows price holding above the EMA cluster, yet repeated tests around the upper band suggest supply is still present overhead.
On the weekly chart, the uptrend is intact (Trend Indicator green), but the current zone looks like late-stage consolidation near prior highs rather than a clean breakout.
My read: Constructive, but still the most sensitive to any “risk appetite” wobble because it’s sitting closest to overhead supply.
IWM - The standout, small-caps appear to clear the ceiling
IWM is still the standout. Daily action pushed higher and remains well-supported by rising EMAs, while the weekly chart shows a persistent uptrend and strong relative posture versus the other two ETFs.
My read: Leadership from small caps is an important breadth confirmation signal. When IWM leads, rallies tend to be more “market-wide” instead of narrow.
Breadth dashboard: more confirmation, less exuberance
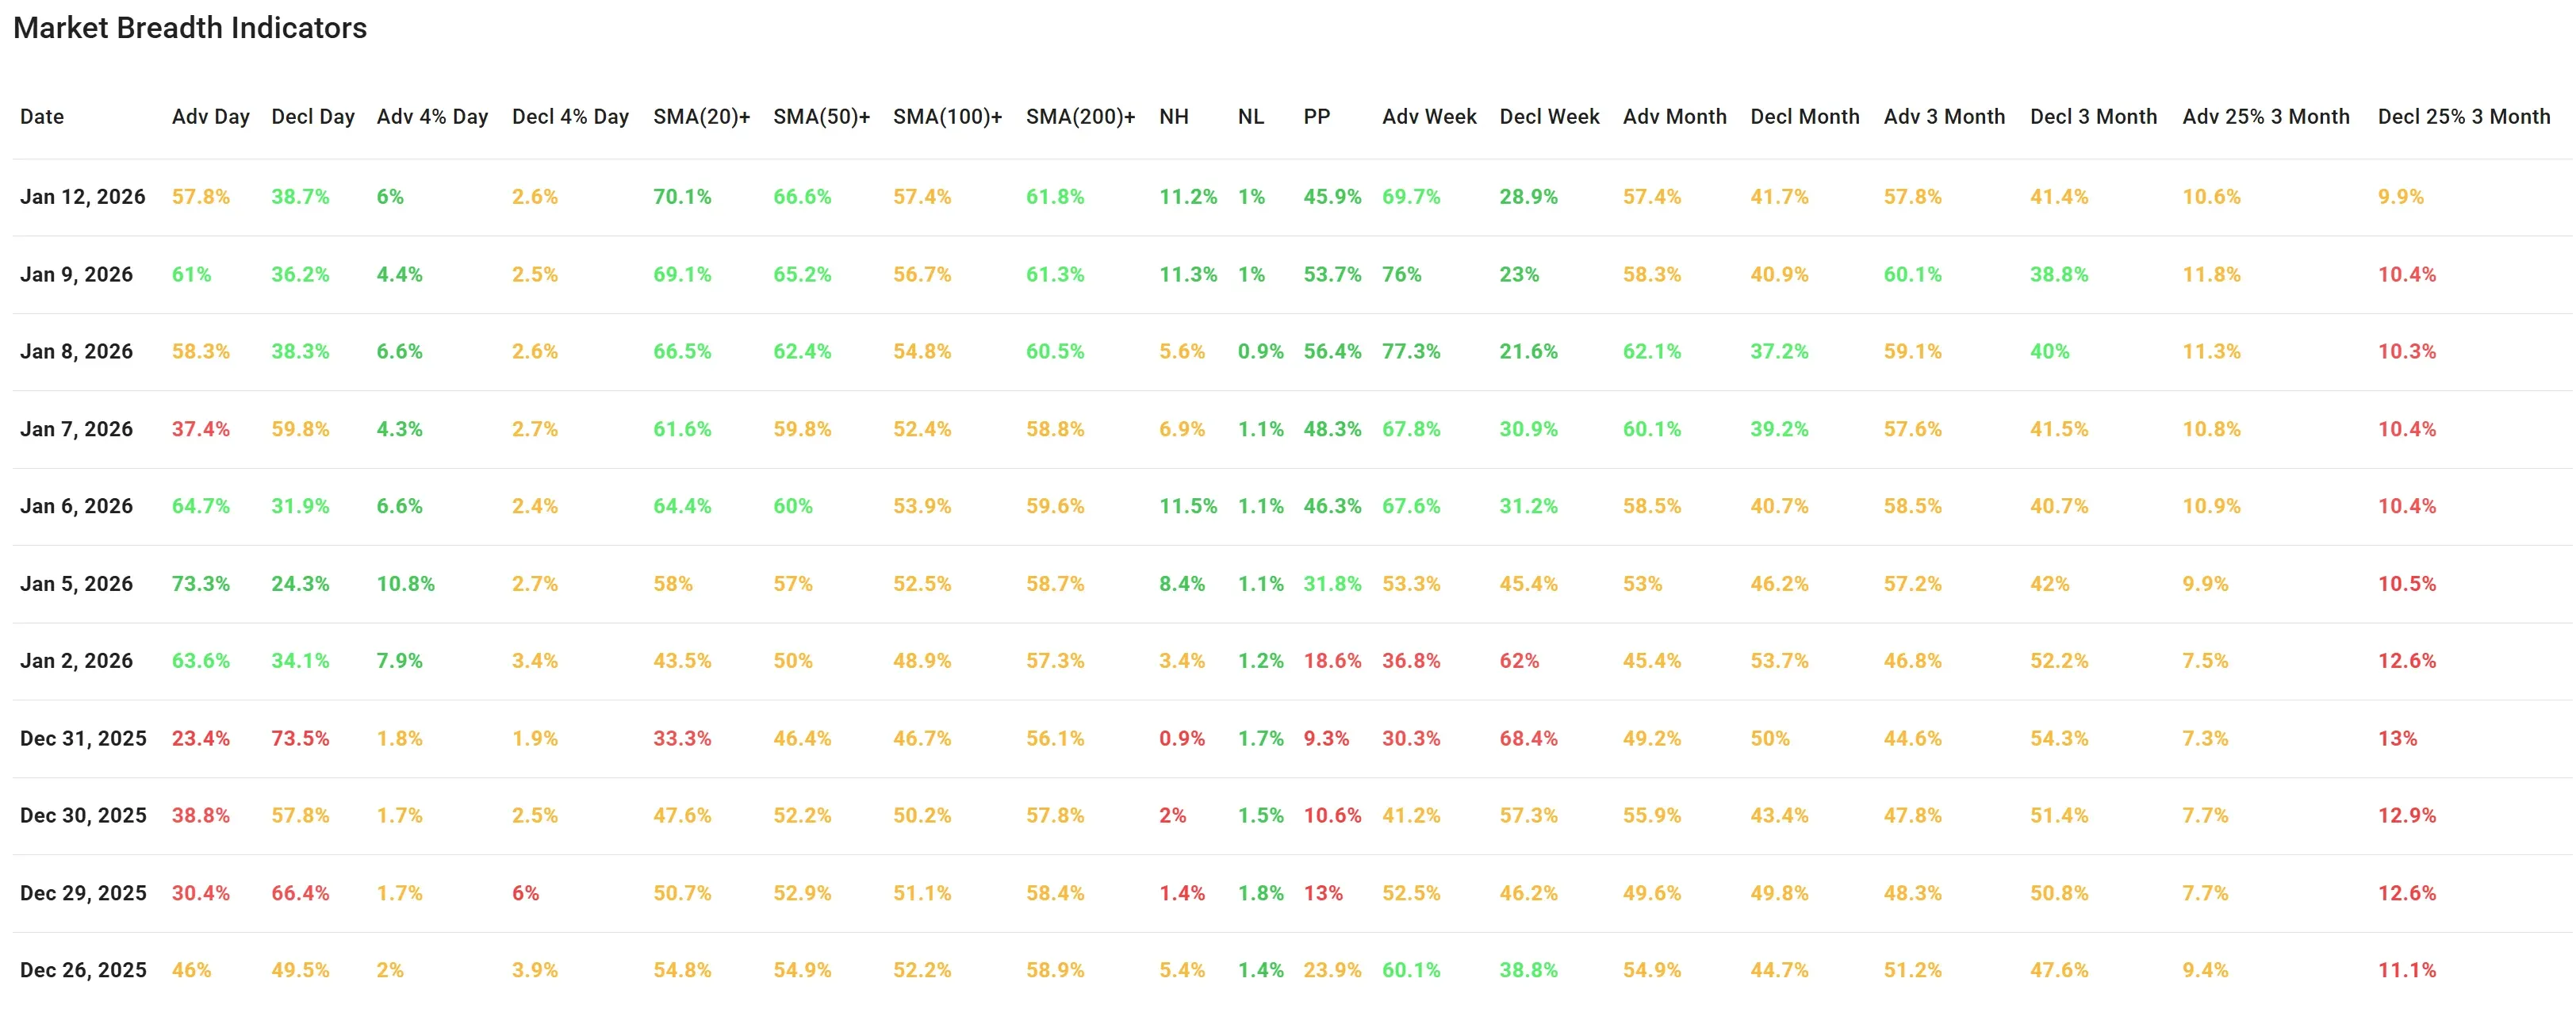
Here’s what stands out most in the latest breadth metrics:
Participation remains elevated (the “healthy rally” signature)
-
SMA(20)+: 70.1%
-
SMA(50)+: 66.6%
-
SMA(100)+: 57.4%
-
SMA(200)+: 61.8%
That combination is hard to dismiss: it signals broad participation across timeframes, not a rally held up by a small group of mega-caps. It also aligns with what the index charts show: uptrends are intact, and pullbacks have been shallow.
New highs vs new lows remains very favorable
- NH: 11.2% vs NL: 1.0%
That’s an emphatic positive. When new lows stay compressed while new highs remain elevated, it typically indicates risk is being absorbed well and breakdowns are not spreading.
Short-term breadth is positive, but cooling
-
Adv Day 57.8% vs Decl Day 38.7%
-
Weekly Adv 69.7% vs Weekly Decl 28.9%
These are still strong readings, yet compared with the prior sessions in your table, the weekly thrust has softened (Adv Week has slipped from the mid/high 70s recently). That fits the price action: SPY and QQQ are digesting rather than surging.
“Pressure gauge” cooled notably
- Pocket Pivots: 45.9% (down from the 50s in the prior rows)
This drop suggests less internal momentum even though the broader participation backdrop stays supportive. In practice, that often means fewer easy breakouts, more chop, and a higher premium on selectivity.
What changed versus the prior breadth read
In the previous update, the story was improving participation and widening strength—especially with small caps acting better. That core theme still holds:
-
IWM leadership continues (bullish confirmation).
-
The SMA participation stack (20/50/100/200) remains strong (bullish foundation).
-
NH/NL stays decisively positive (risk remains contained).
What shifted is the pace:
-
The market is still healthy, but it’s transitioning from expansion → consolidation.
-
Breadth is no longer “getting better fast”; it’s staying good while momentum cools.
This is a common rhythm in sustainable advances: strong breadth builds the base, then price pauses while leadership rotates and late entries get “shaken out.”
Bottom line: constructive trend, but don’t confuse “healthy” with “easy”
The internal backdrop remains solidly positive, and small-cap leadership is a meaningful tailwind for breadth. But the cooling in the shorter-term thrust metrics argues for a market that may continue higher, yet likely through grind and rotation rather than a straight-line rally.
Breadth trend rating (1–7)
Rating: 6 - Positive
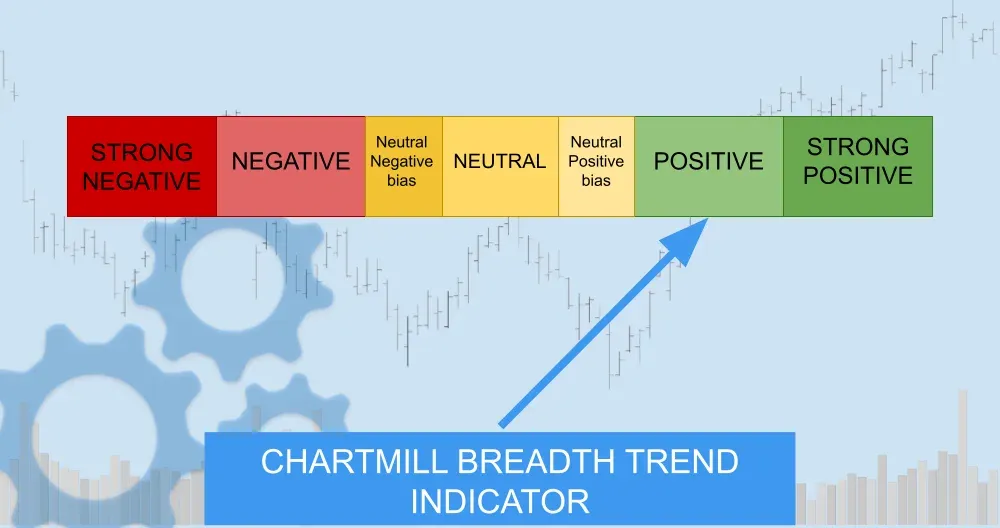
If breadth re-accelerates, this could quickly move toward 'Very positive'(7). For now, the evidence supports staying constructive, but with realistic expectations about near-term chop near resistance, especially in QQQ.
Kristoff
Next to read: Trump’s Iran Tariff Threat Lit a Fuse Under Oil — and Wall Street Still Sold It