
Wall Street Rises: Trump Delays Tariffs, but Uncertainty Remains
U.S. markets closed higher on Wednesday, largely driven by the delay of import tariffs that President Trump had planned for the auto industry.
The Dow Jones and S&P 500 both gained 1.1%, while the Nasdaq closed 1.5% higher. American automakers, including General Motors (GM | +7.2%) and Ford (FORD | +5.8%), benefited the most from the announcement.
Market Still Uncertain About Trade Policy
While the tariff delay was seen as a positive development, uncertainty surrounding U.S. trade policy remains high. Canadian Prime Minister Justin Trudeau stated that Canada is unwilling to negotiate unless all Trump tariffs are fully removed. World leaders appear to be growing increasingly frustrated with the unpredictable nature of U.S. trade strategy.
Economic Developments and Key Data
The Federal Reserve’s Beige Book reported a slight increase in U.S. economic activity since January, with price increases accelerating in some regions.
The job market saw a setback: private-sector employment grew by only 77,000 jobs in February, far below the expected 148,000. Meanwhile, mortgage applications surged by 20.4%, indicating possible strength in the housing market.
The services sector showed mixed signals. The S&P Global Purchasing Managers’ Index (PMI) pointed to slowing growth, while the ISM index indicated an acceleration. Factory orders rose by 1.7% in January, aligning with expectations.
Corporate News: Winners and Losers
Foot Locker (FL | +5.2%) surprised investors with better-than-feared results, while Abercrombie & Fitch (ANF | -9.2%) dropped due to a disappointing outlook.
CrowdStrike (CRWD | -6.3%) fell after issuing weak guidance, while Palantir Technologies (PLTR | +6.8%) gained following an analyst upgrade.
Tesla (TSLA | +2.6%) recovered slightly after steep losses earlier in the week, and Nvidia (NVDA | +1.1%) edged higher after a 13% decline since its latest earnings report.
Oil prices fell 2.9% to $66.31 per barrel on Wednesday, following an increase in U.S. crude oil inventories.
Looking Ahead
On Thursday, investors will focus on key economic reports, including weekly jobless claims, the trade balance, and fourth-quarter labor costs. Markets will also keep an eye on further trade policy developments and the economic impact of the U.S.'s shifting tariff strategy.
Daily Market Analysis – March 05, 2025 (After Market Close)

SPY (S&P 500 ETF - $583.06, +1.1%)
- Short-term trend: Still negative, down -1.93% (1 week) and -4.87% (2 weeks).
- Long-term trend: Neutral, down -4.07% (3 months) but still +13.94% (12 months).
- Technical outlook: SPY rebounded from its recent dip (double bottom) but remains in a short-term downtrend. Resistance levels are near $590, while support lies around $570. A sustained move above $590 could signal a trend reversal.
QQQ (Nasdaq 100 ETF - $502.01, +1.3%)
- Short-term trend: Bearish, with -2.44% (1 week) and -6.95% (2 weeks) declines.
- Long-term trend: Remains neutral, +11.88% (6 months) and +14.35% (12 months).
- Technical outlook: QQQ bounced after recent losses and closed again above the $500 round number level, current resistance at $510. The short-term price action suggests ongoing volatility.
IWM (Russell 2000 ETF - $208.47, +0.99%)
- Short-term trend: Negative, +3.34% (1 week) but -7.93% (2 weeks).
- Long-term trend: Negative, weaker than large-cap indices, +0.27% (6 months) but -12.75% (12 months).
- Technical outlook: IWM remains in a longer-term downtrend. A move above $215 would be needed for a more positive outlook.
Technical Conclusion
The market rebounded slightly, with SPY, QQQ, and IWM all posting gains, but the short-term downtrend remains intact. While long-term trends for SPY and QQQ are still neutral, small caps (IWM) continue to lag behind. Further confirmation of strength is needed before declaring a trend reversal.
Sector Analysis
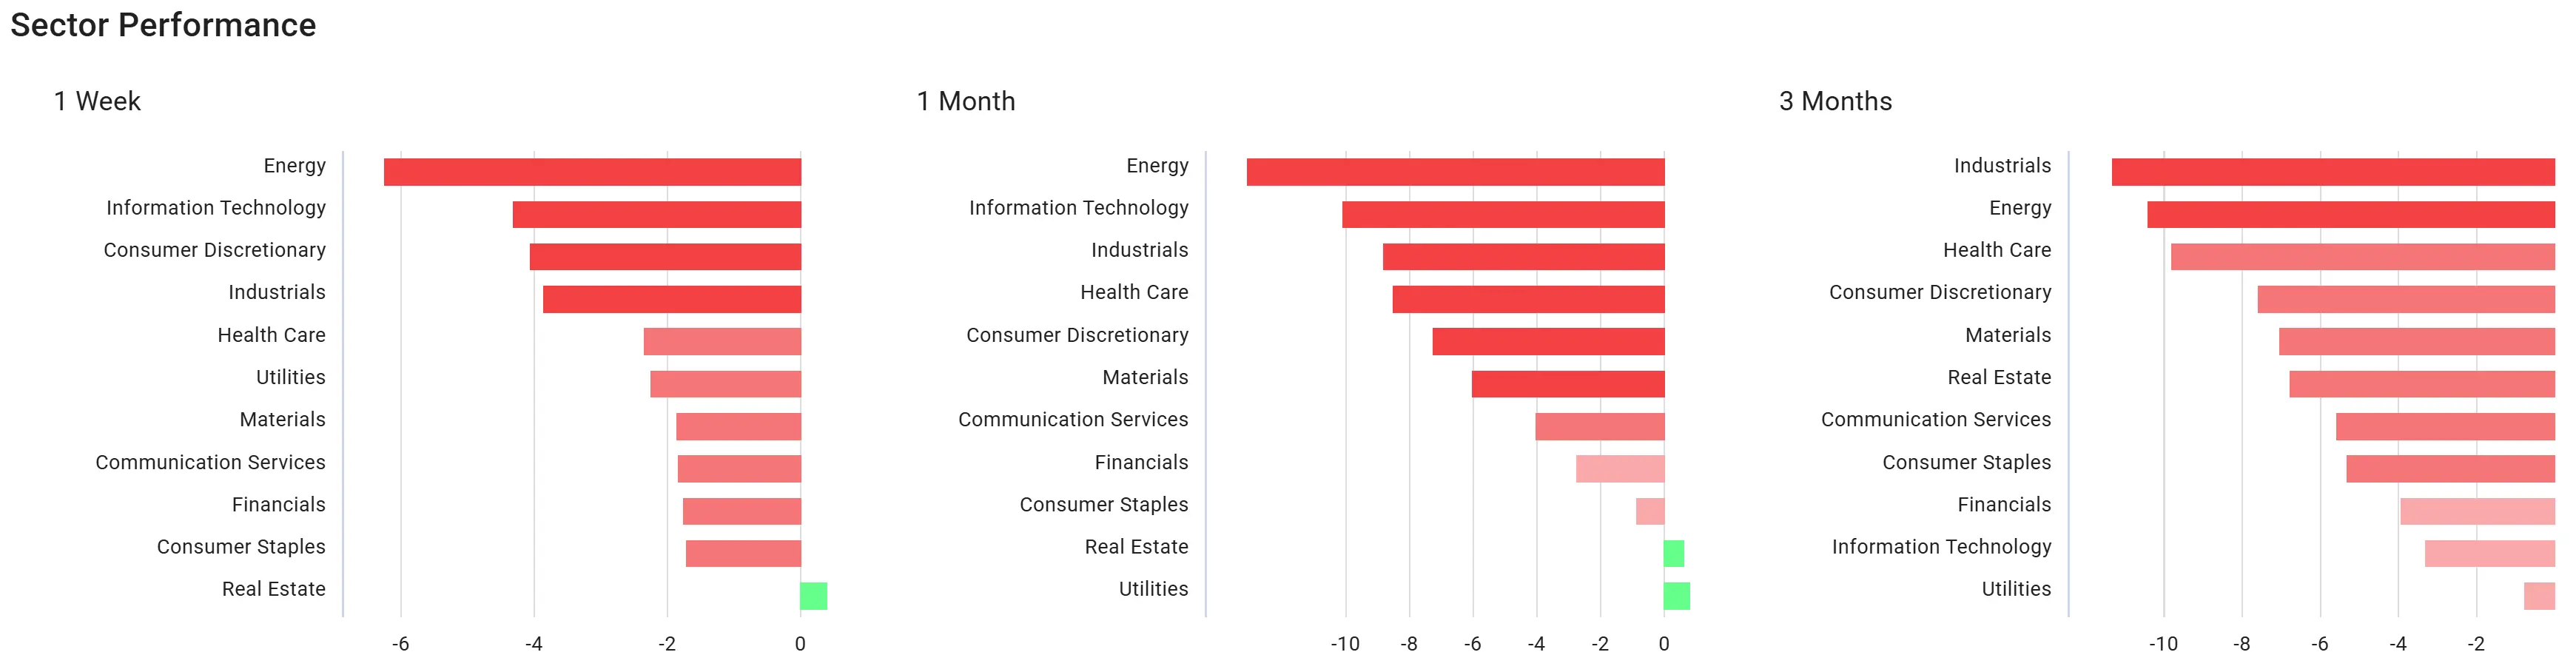
- Short-term (1 week): Broad market weakness, especially for Enery, Information Technology and Consumer Discretionary
- Mid-term (1 month): Tech and Energy were among the worst performers, Real estate and utilities are barely positive on a monthly basis (no changes to march 04).
- Long-term (3 months): All negative, Industrials performing the worst (no changes to march 04)
Market Breadth Analysis
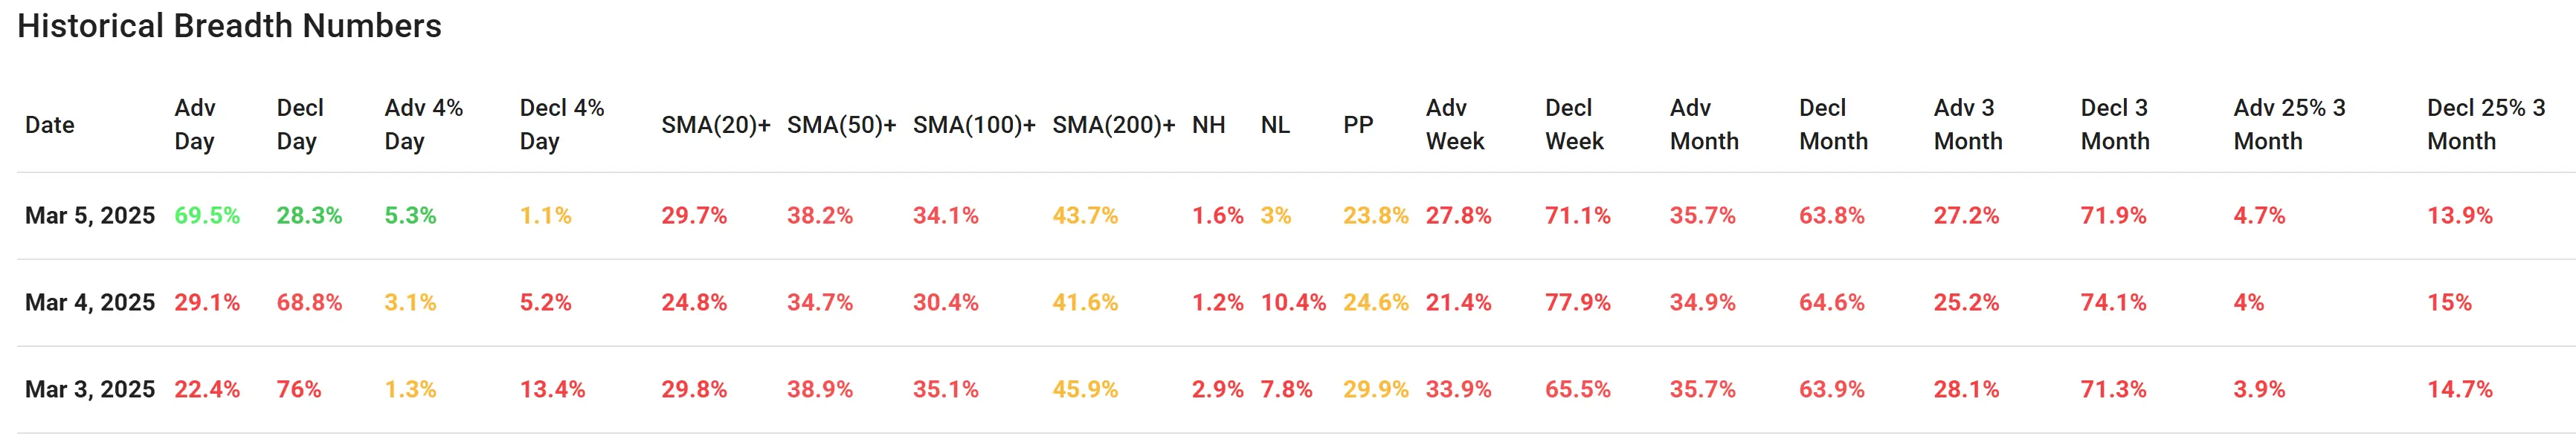
- Advancing stocks: 69.5% (up significantly from 29.1% on March 4).
- Declining stocks: 28.3% (down from 68.8% on March 4).
- SMA(50+): 38.2% (up from 30.4%).
- SMA(200+): 43.7% (slightly higher than 41.6%).
Comparison with Previous Days
- March 4 showed broad market weakness, but March 5 saw a significant recovery, reversing most of the prior day’s declines.
- March 3 had weak breadth as well, with only 22.4% advancing stocks, meaning March 5 marked a strong rebound from earlier weakness.
- More stocks are trading above their 50-day and 200-day SMAs, signaling potential stabilization.
Market Breadth Conclusion
The market breadth saw a strong improvement on March 5, suggesting that the prior day's selloff may have been overdone. However, it remains to be seen if this rebound can be sustained. The overall trend still reflects uncertainty, but a continuation of advancing stocks could signal a shift back toward bullish momentum.
Final Market Outlook
- The market showed short-term recovery on March 5, but SPY, QQQ and IWM remain in a short-term downtrend.
- The market breadth improvement is encouraging, but further confirmation is needed for a sustained rally.
Going forward, watch for follow-through strength, as well as further improvements in market breadth to confirm the recovery. If selling resumes, expect volatility to persist in the coming sessions.