
U.S. stock markets ended positively following a volatile session driven by corporate earnings reports and cautious signals from the Federal Reserve.
Despite initial uncertainty, major indices closed higher, demonstrating resilience amid mixed economic signals.
Fed Holds Interest Rates Steady Amid Growing Uncertainty
As expected, the Federal Reserve left the benchmark interest rate unchanged at a range of 4.25% to 4.50%. Fed Chair Jerome Powell highlighted increasing uncertainties around the economy, specifically mentioning risks of rising unemployment and inflation. Powell emphasized the central bank's data-driven stance, noting, "We focus solely on economic data, unaffected by political statements."
"We focus solely on economic data, unaffected by political statements." - Jerome Powell, Fad Chairman
Powell underscored the U.S. economy's fundamental strength, noting stable consumer spending despite declining confidence levels. He also indicated that although recent trade tariffs could drive inflation and unemployment higher in the long term, current conditions remain manageable.
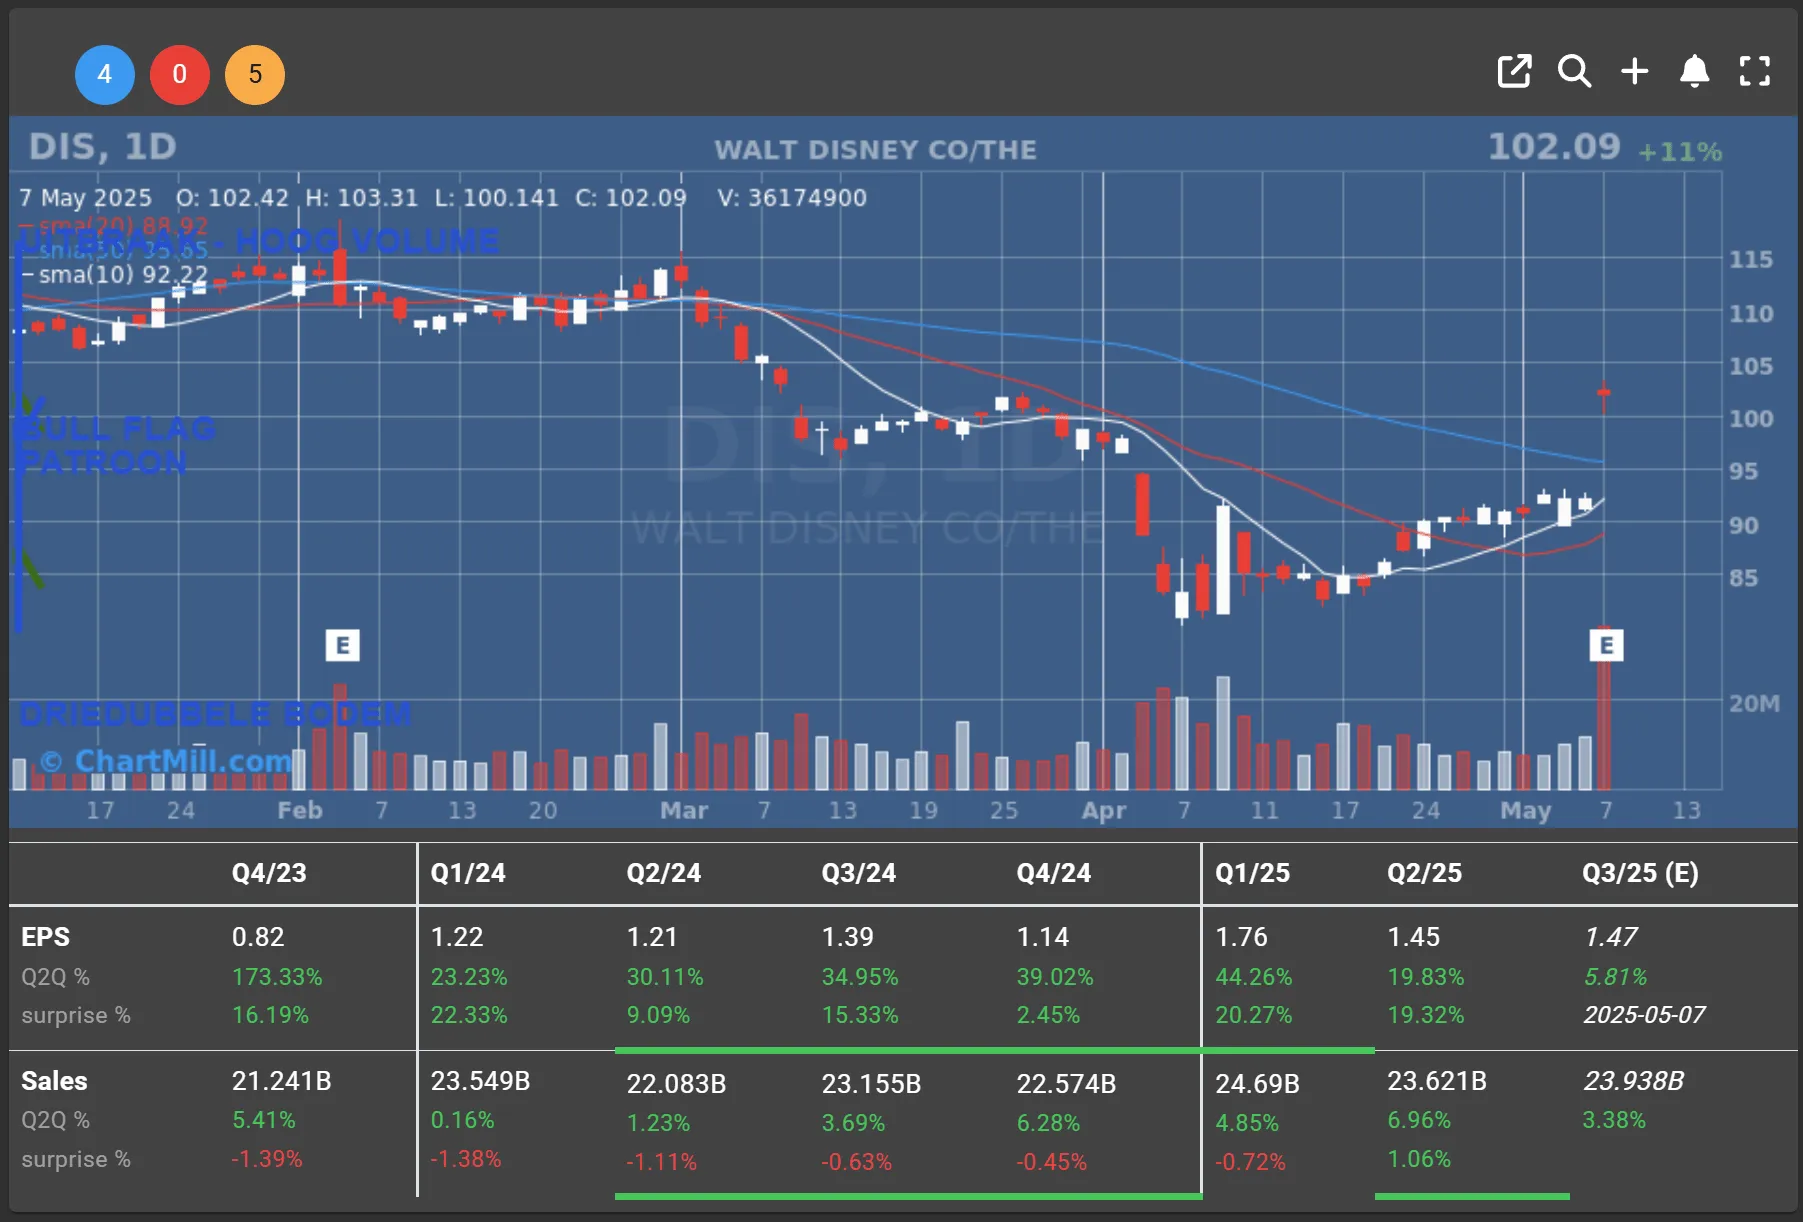
Disney Shines with Impressive Quarterly Results
Disney (DIS | +10.76%) surged nearly 11% after beating market expectations with robust quarterly earnings. Revenues climbed 7% to $23.6 billion, driven by strong performance from theme parks and the streaming service Disney+, which added 1.4 million subscribers.
CEO Bob Iger expressed optimism, projecting a 16% growth in earnings per share for the year. Analysts praised Disney's results, noting that concerns regarding competition and consumer spending were significantly alleviated.
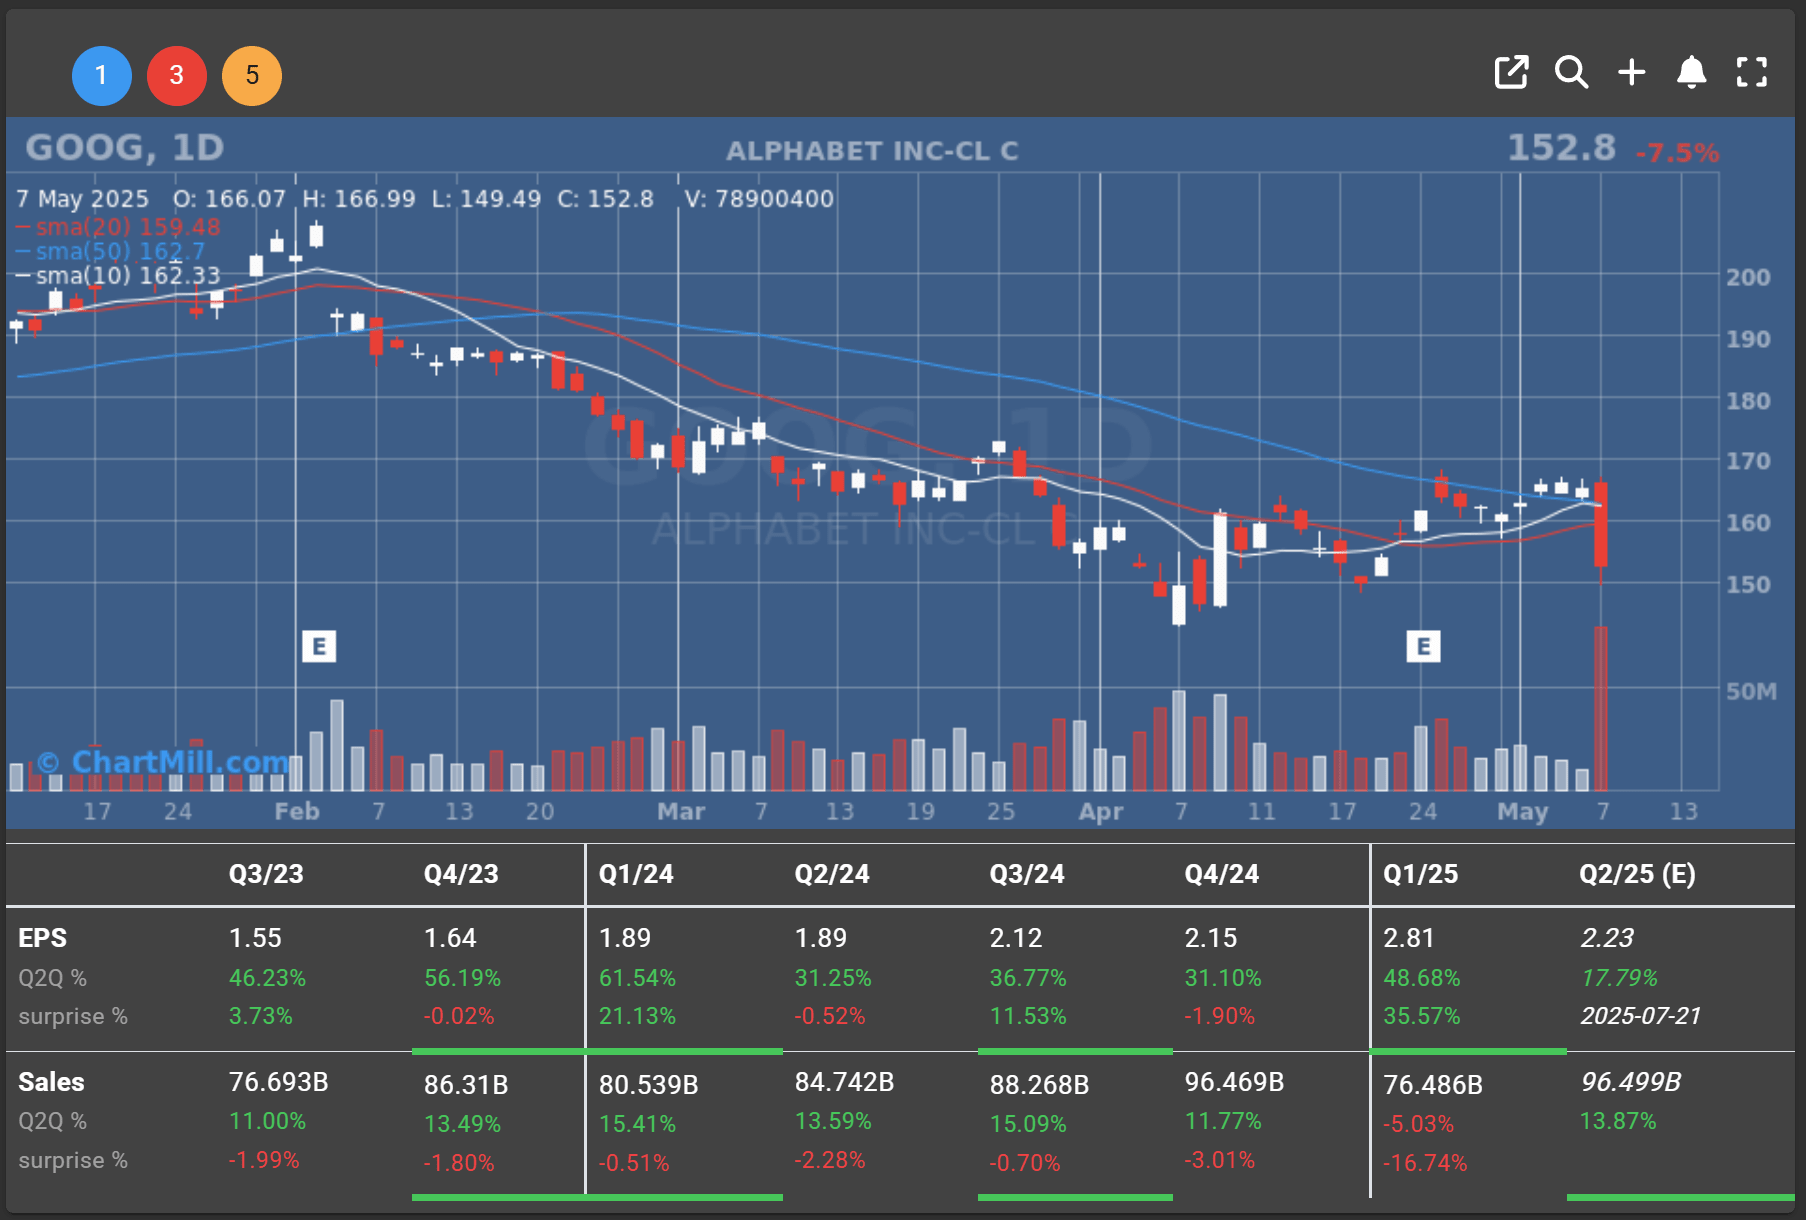
Alphabet Plunges on Apple Partnership Concerns
In stark contrast, Alphabet's (GOOG [ -7.51%) stock fell 7.5% on news that Apple is exploring alternatives for its default Safari browser search engine. Currently, Google's parent company pays Apple around $20 billion annually for the privilege. Although investors reacted negatively, some analysts suggest losing this expensive partnership might improve Google's profit margins over time.
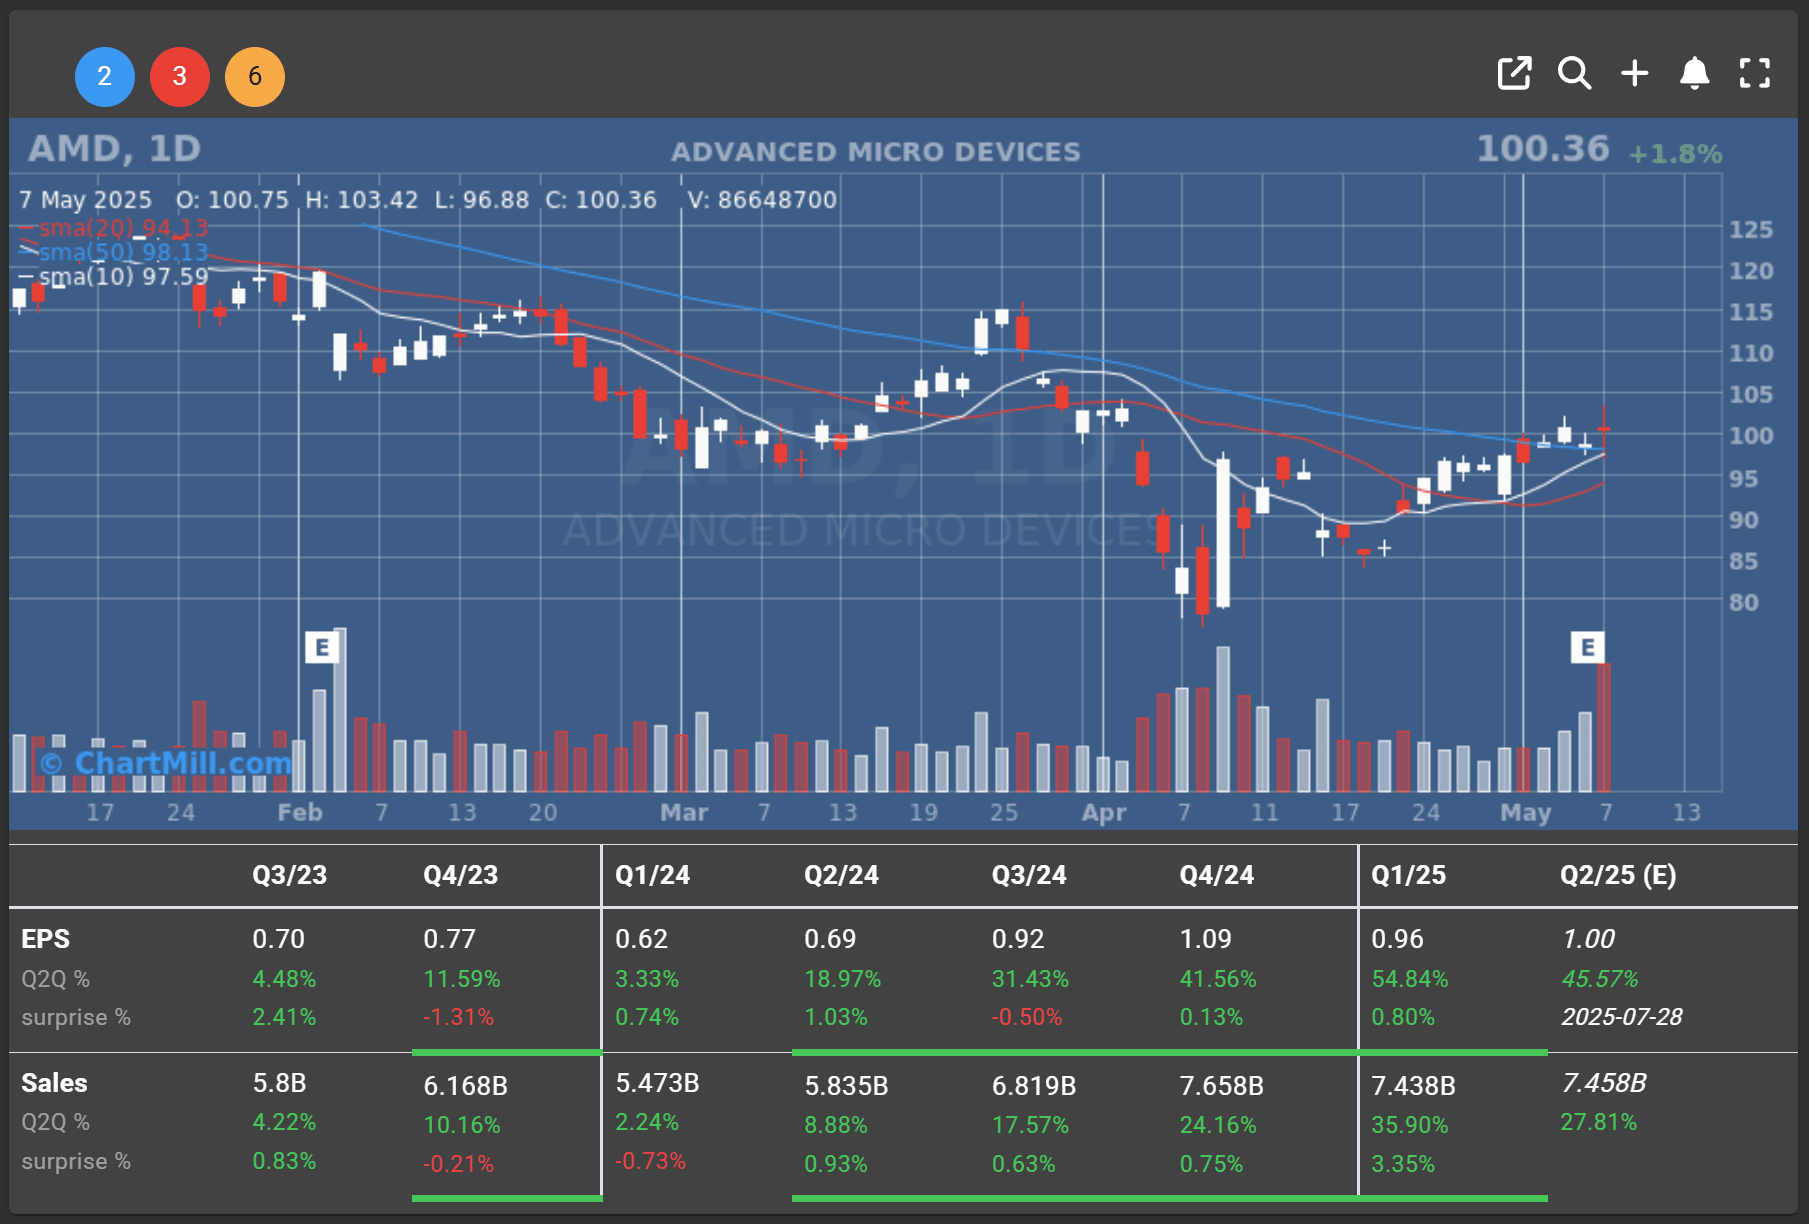
AMD Gains on Strong Results and AI Potential
Advanced Micro Devices (AMD | +1.76%) shares rose by 1.8% after reporting higher-than-expected quarterly revenues of $7.4 billion, driven by a 57% year-over-year growth in its datacenter segment. While uncertainties around AI chip revenues and export controls linger, AMD's strong quarterly performance and guidance have provided investors with confidence.
Economic Data and Global Trade Developments
Markets also responded to positive U.S. economic data, including an 11% weekly increase in mortgage applications. Furthermore, investor sentiment benefited from news of upcoming trade discussions between the U.S. and China, despite continued tensions indicated by potential retaliatory tariffs from the EU.
Sector Highlights and Stock Movements
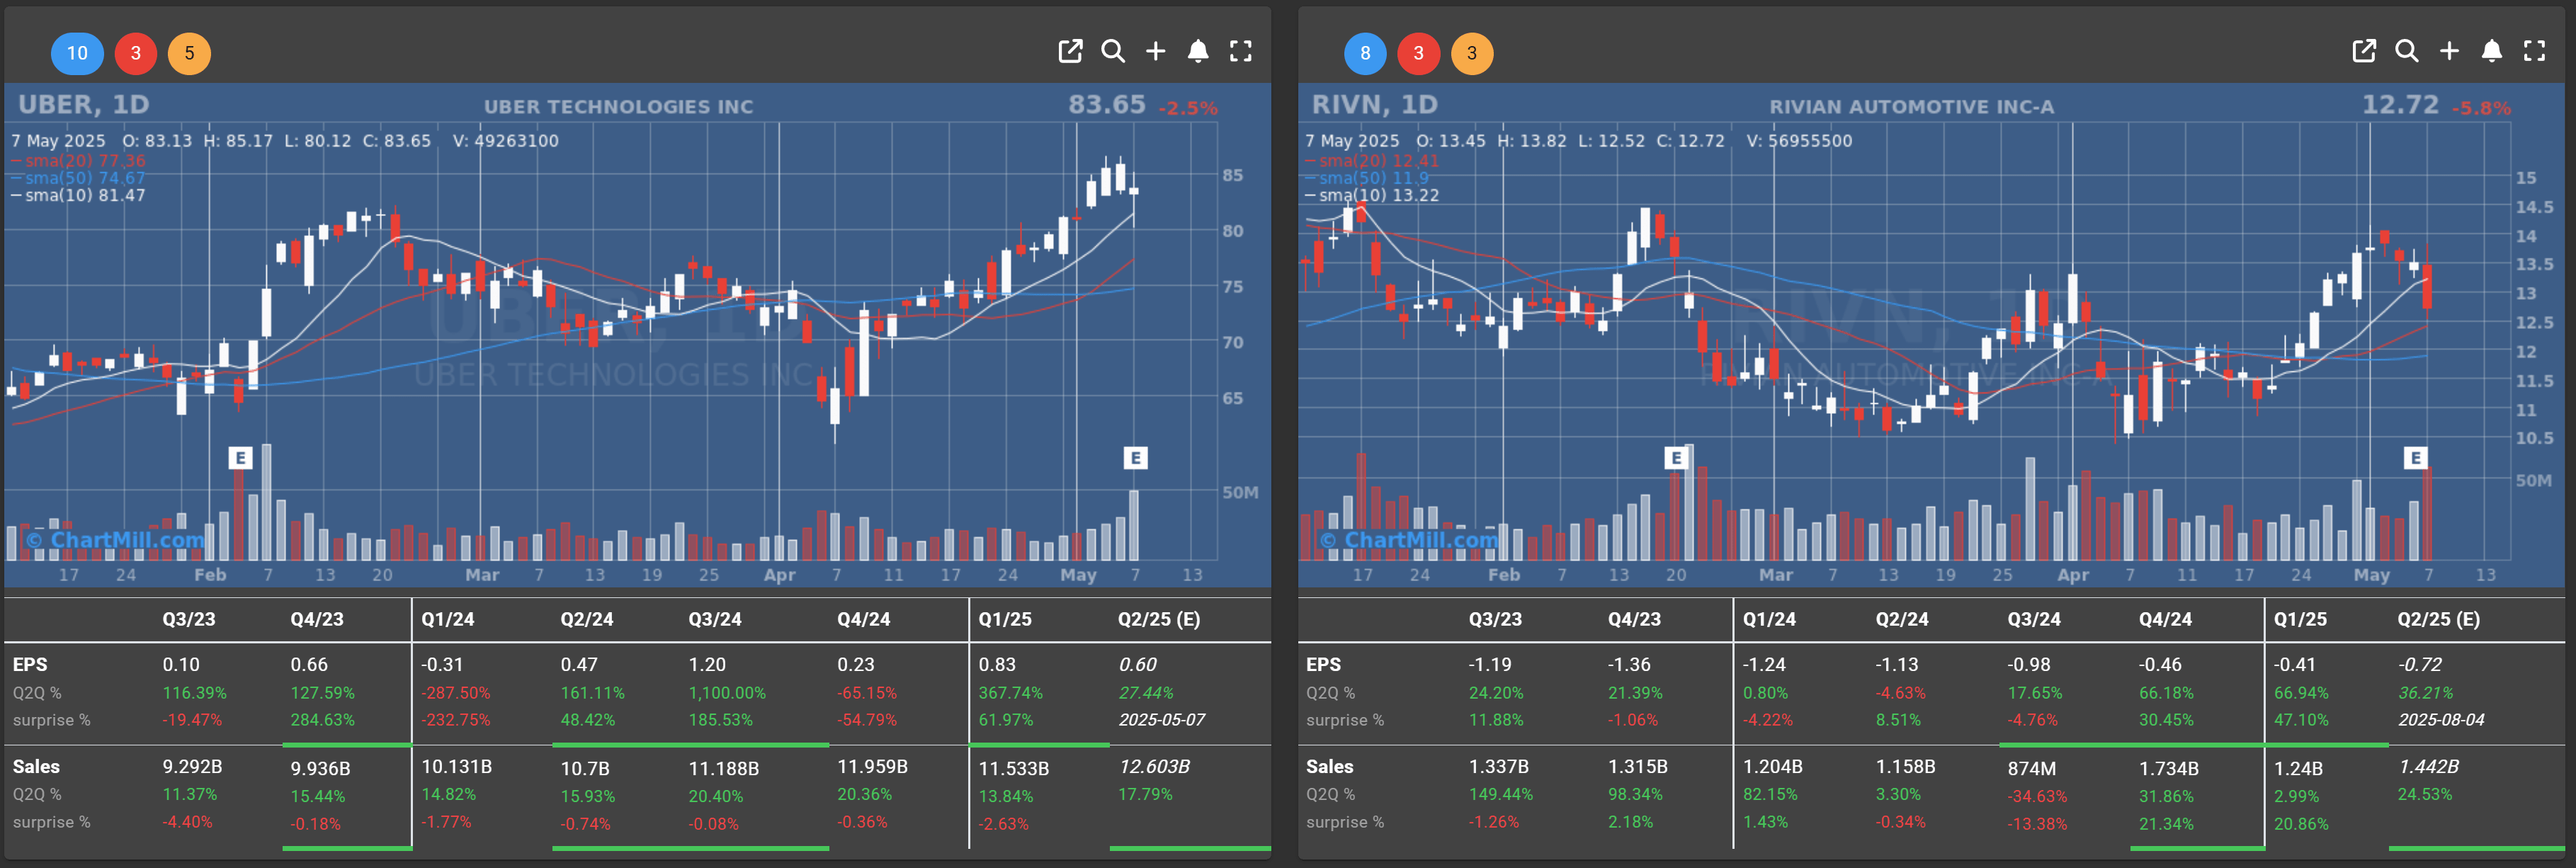
Other notable movers included Rivian Automotive (RIVN | -5.78%), which fell by 5.8% after lowering delivery projections due to global trade disruptions.
Uber (UBER | -2.54%) declined by 2.6% despite reporting profitability and growth in ride-sharing services.
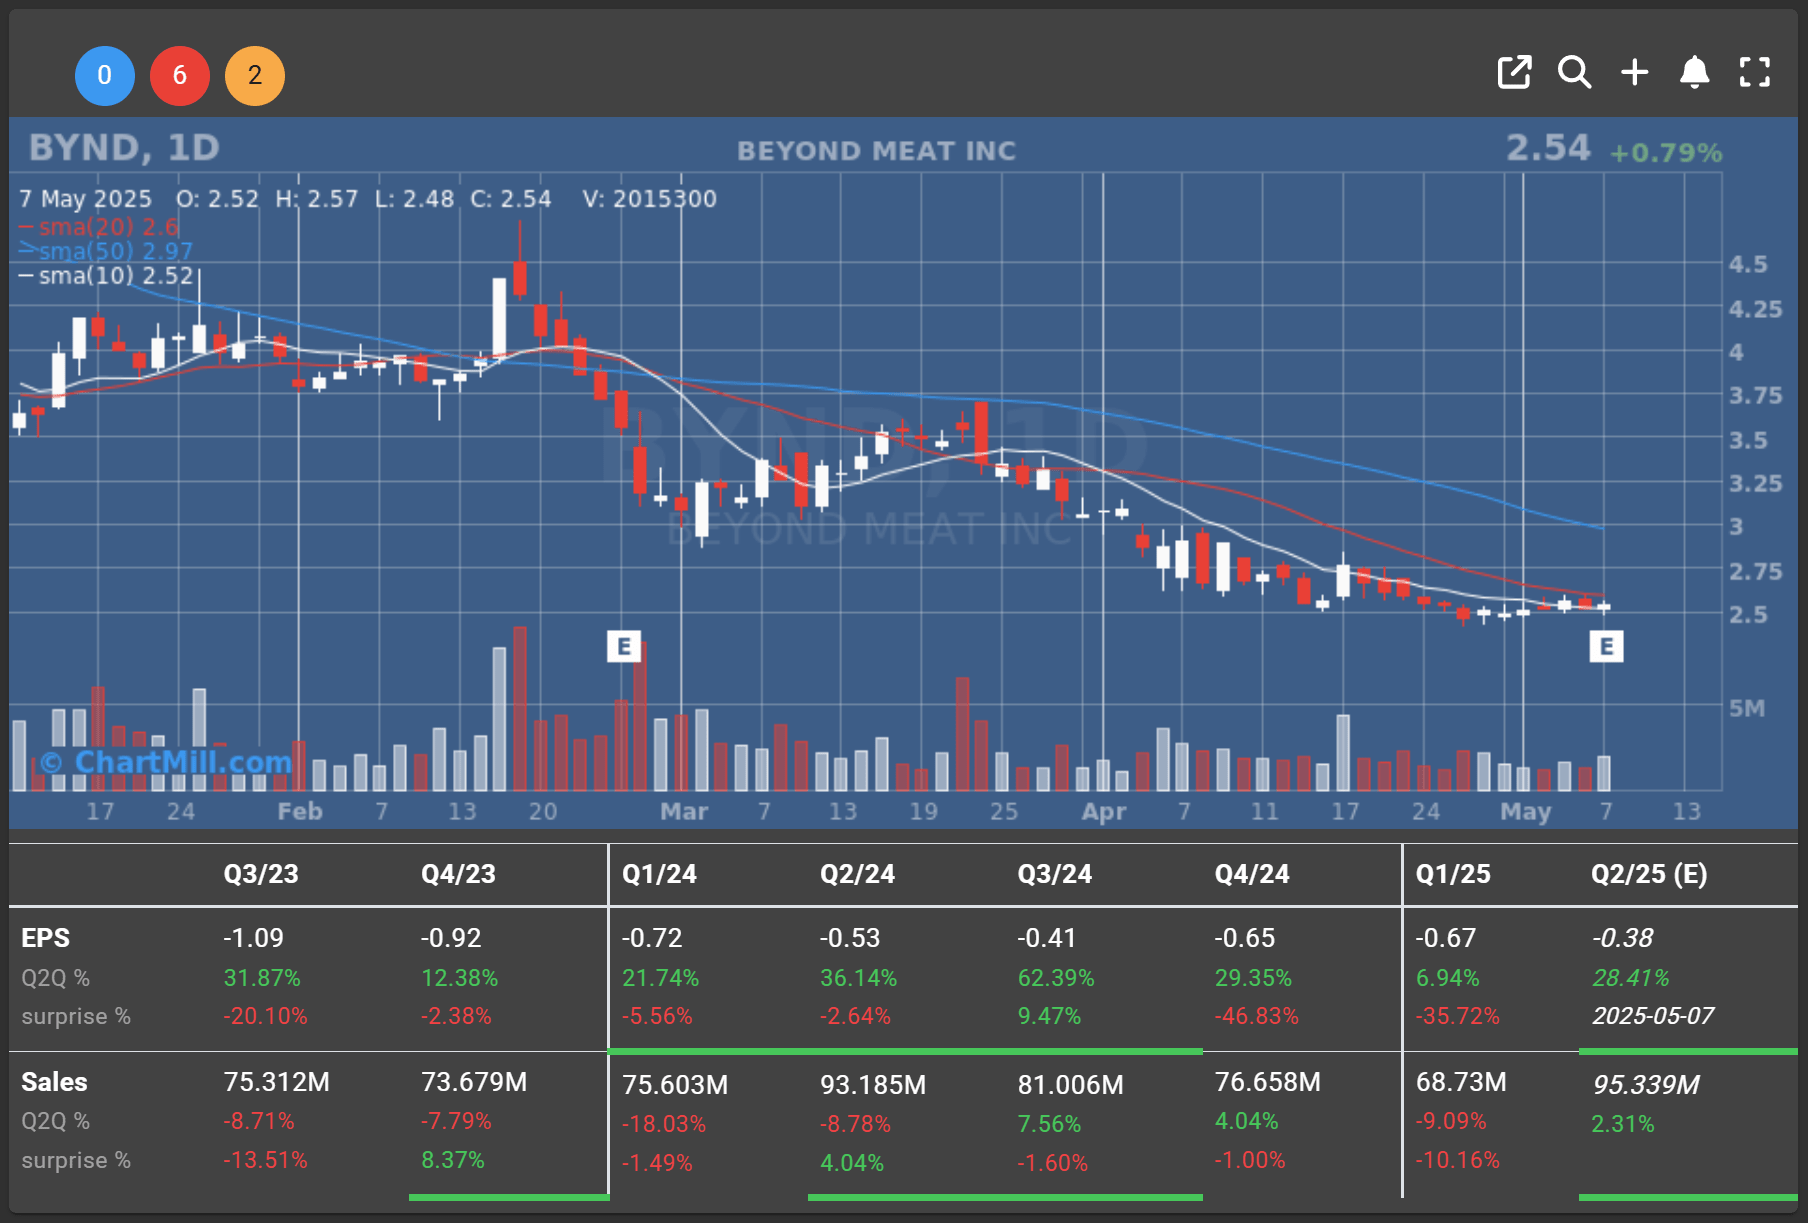
Beyond Meat (BYND | +0.79%) reported a drop in Q1 2025 revenue to $68.7 million, down from $75.6 million a year earlier, due to an 11.2% decline in product volumes. The company posted a net loss of $52.9 million and withdrew its full-year guidance citing increased uncertainty. Beyond also secured up to $100 million in financing from the Ashima Foundation and expects Q2 revenue between $80 and $85 million.
Shares fell 5.5% in after-hours trading.
Market Outlook
Investors remain cautiously optimistic, closely watching economic indicators and geopolitical developments. With corporate earnings continuing to provide momentum, Wall Street's near-term outlook appears cautiously positive, balanced by awareness of potential headwinds from macroeconomic factors.
Daily Market Analysis – May 7, 2025 (After Market Close)
Short Term Trend

- Short-Term Trend: Bullish (no change)
- Support at $490 - $550
- Resistance at $580
- Volume: Below average (50)
- Pattern: Doji Candle - possible start of a bullish flag formation
- Short-Term Trend: Bullish (no change)
- Support at $470
- Resistance at $490
- Volume: Below average (50)
- Pattern: Doji Candle - possible start of a bullish flag formation
- Short-Term Trend: Bullish (no change)
- Support at $195
- Resistance at $210-215
- Volume: Significant below average (50)
- Pattern: Doji Candle - possible start of a bullish flag formation
Long Term Trend

- Long-Term Trend: Neutral (no change)
- Long-Term Trend: Neutral (no change)
- Long-Term Trend: Down (no change)
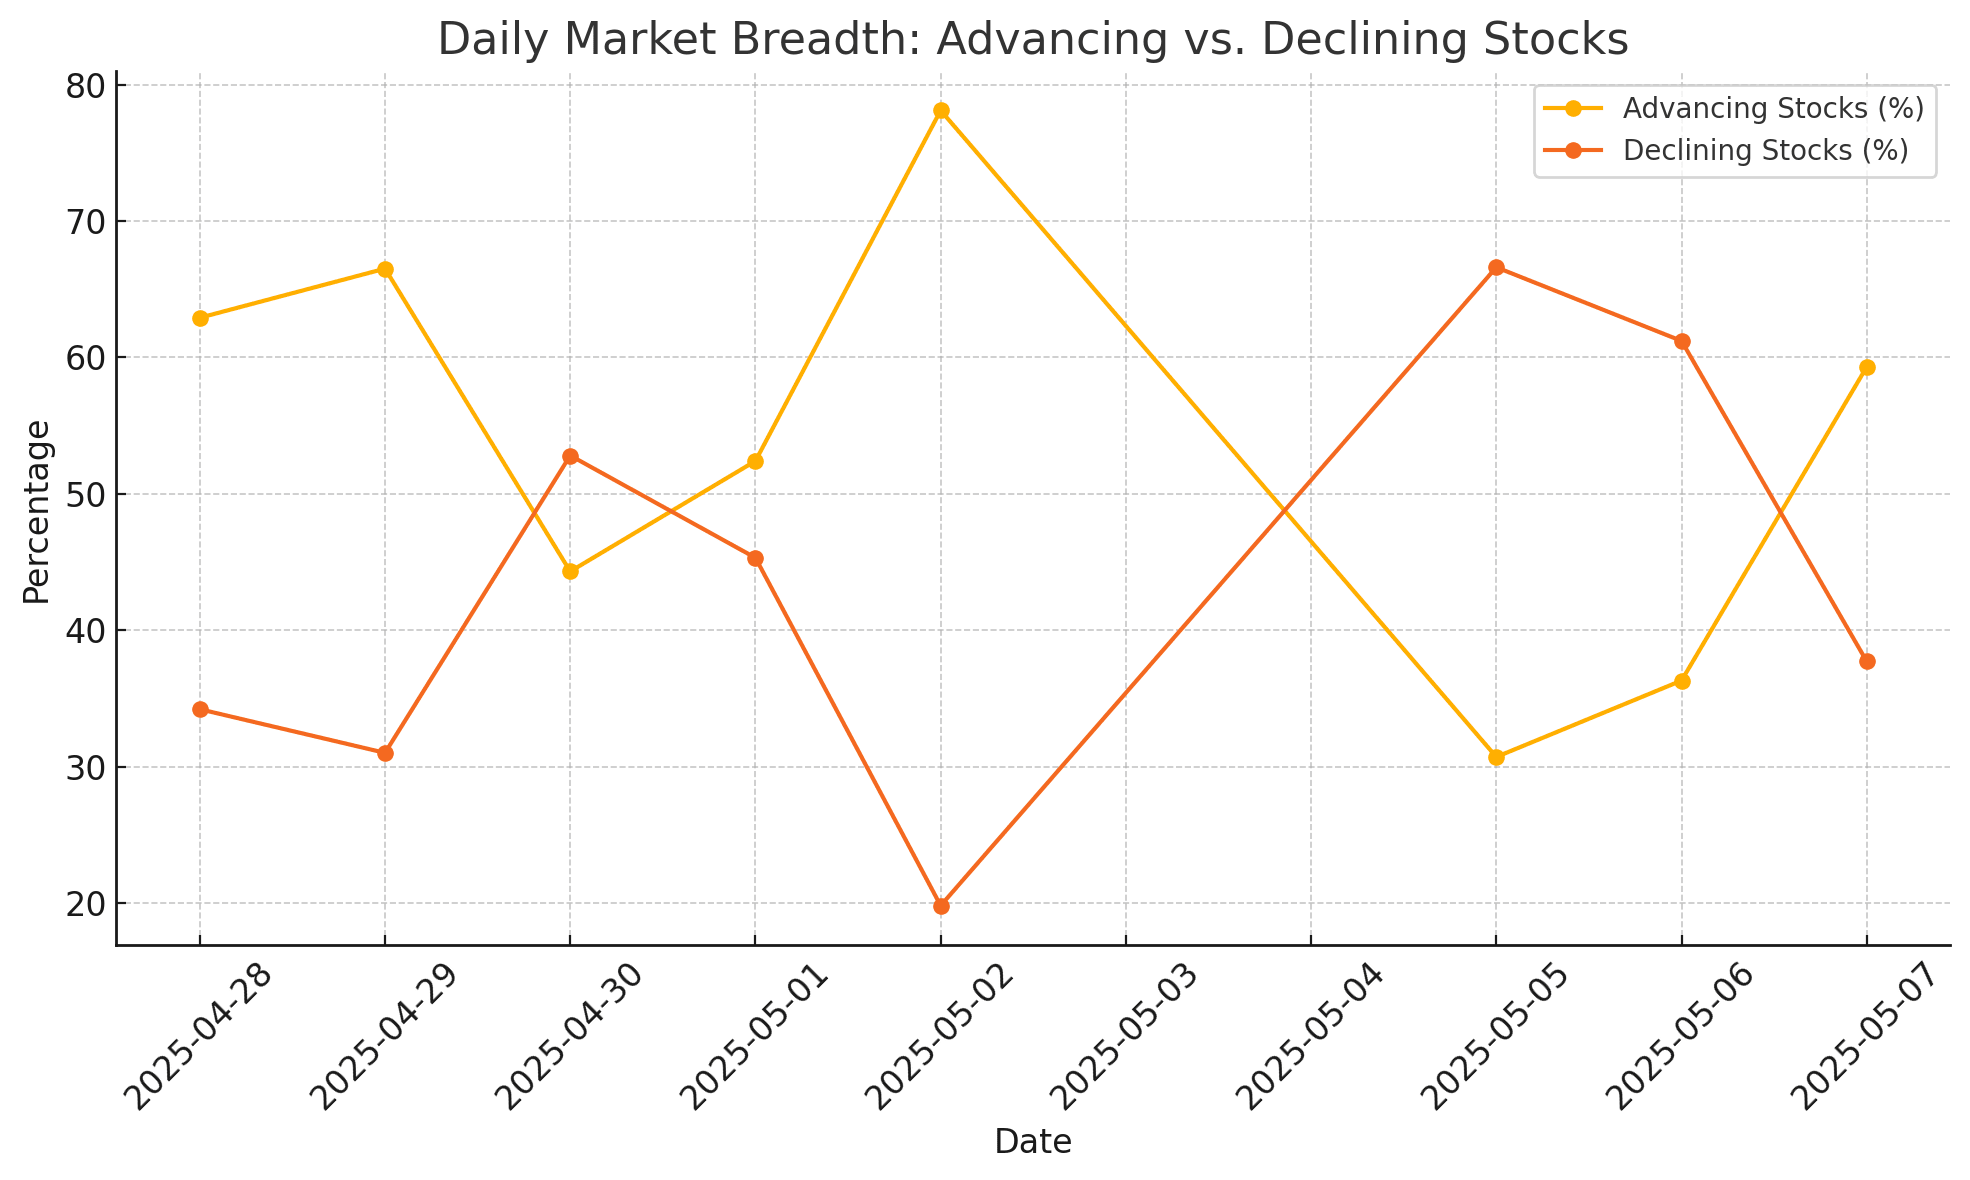
Market Breadth Analysis for May 7, 2025 (After Market Close)
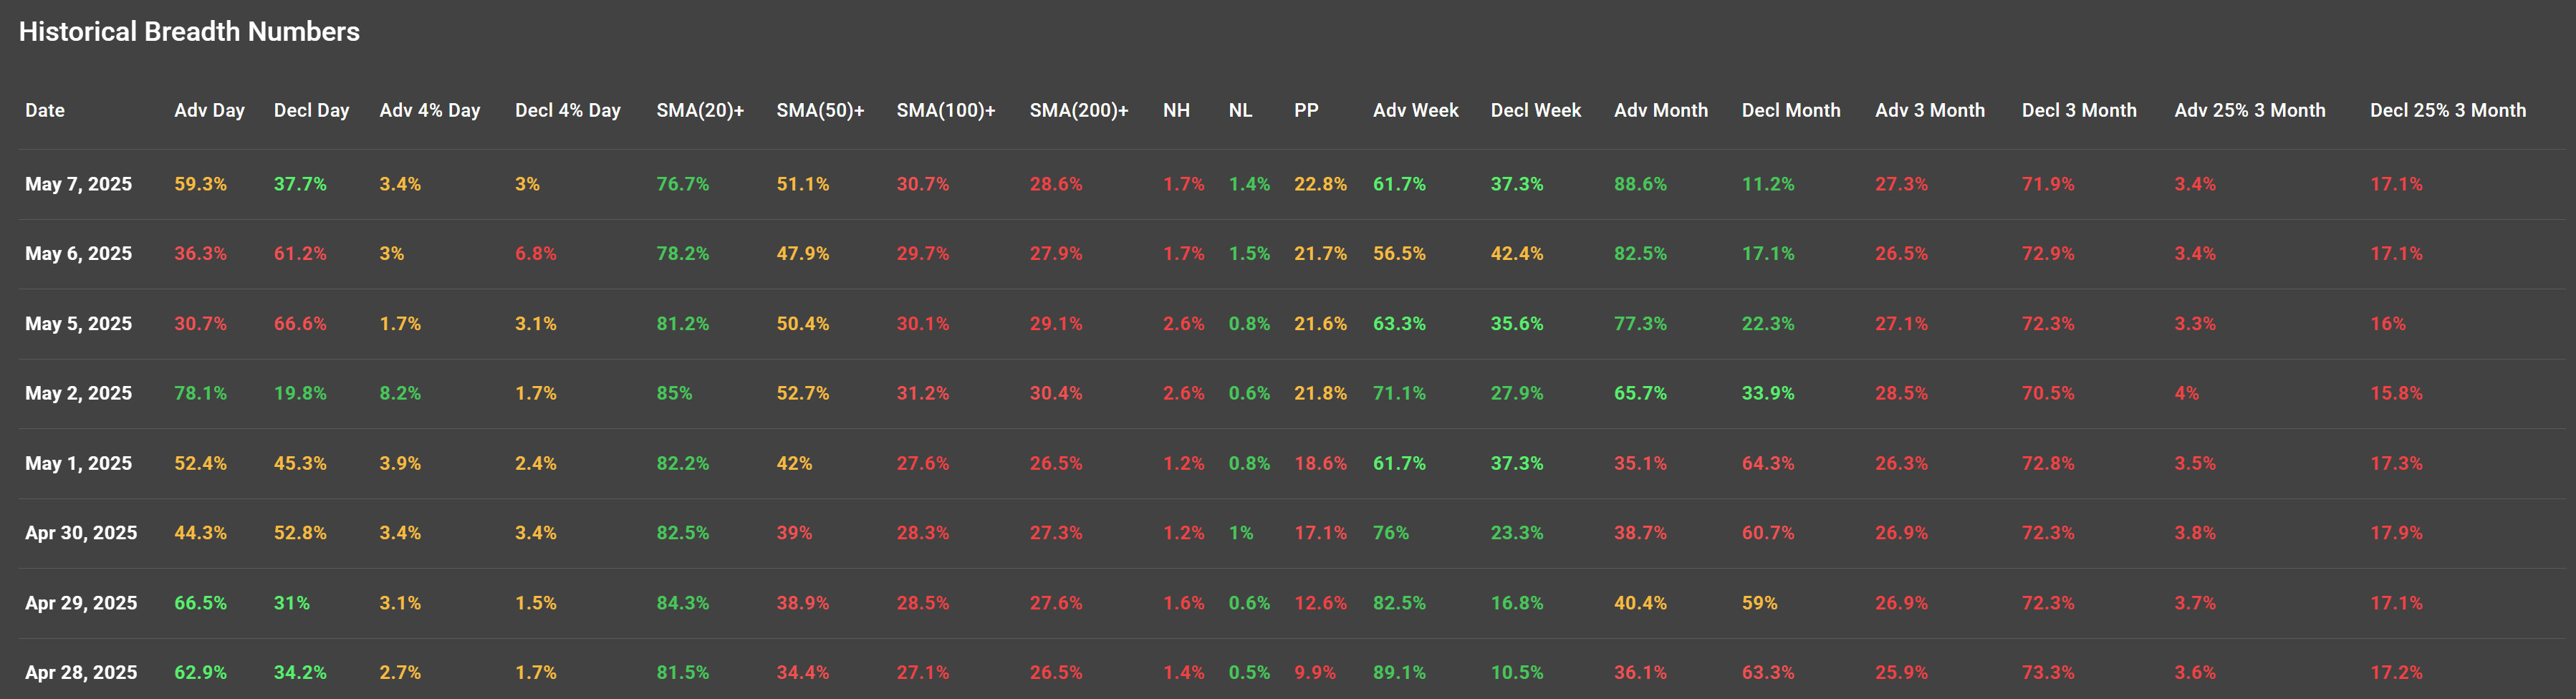
The most recent session (May 7) reflected a moderate positive breadth, with 59.3% of stocks advancing and 37.7% declining. This indicates a recovery from May 6, when only 36.3% of stocks advanced, suggesting renewed bullish momentum.
Short-Term Breadth Shifts
-
The bounce on May 7 came after two consecutive down days (May 5 and May 6), where declining stocks consistently outnumbered advancing ones.
-
May 2 remains the strongest breadth day in this period, with 78.1% of stocks advancing and only 19.8% declining.
-
The % of stocks above the 20-day SMA dipped slightly to 76.7% (from 85% on May 2), indicating some short-term weakening but still holding well above 70%, a positive sign.
-
However, the 50-, 100-, and 200-day SMA participation remains relatively low. Only 51.1% of stocks are above their 50-day SMA, and fewer than a third are above their 100- and 200-day SMAs, reflecting weak intermediate-to-long-term breadth.
Momentum and Volatility Signals
-
High-volume or high-magnitude moves (stocks up/down 4% or more) remained modest, with 3.4% of stocks gaining and 3% losing at least 4% on May 7.
-
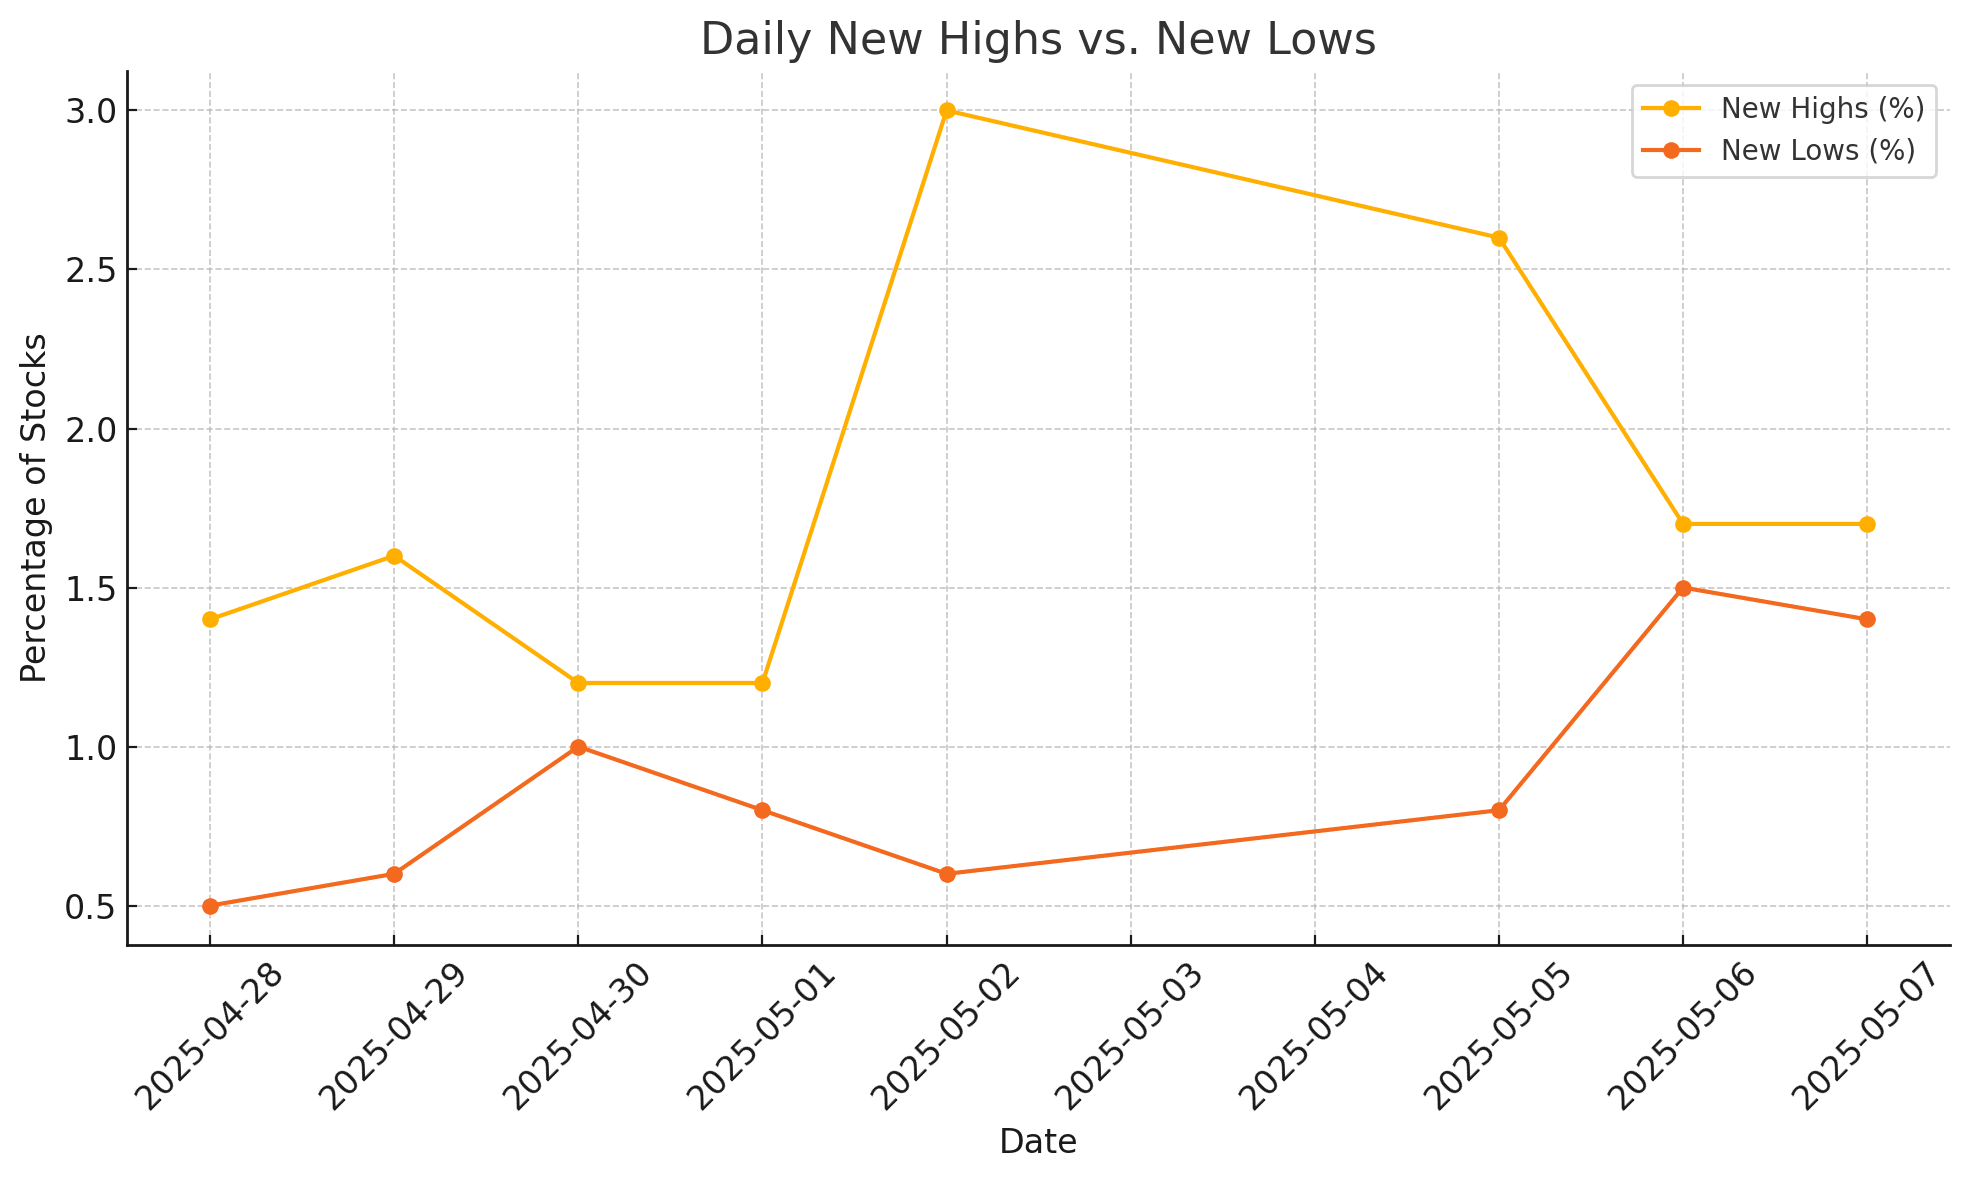
New Highs (NH) and New Lows (NL) remain low and stable, both under 2%, which suggests the market isn't experiencing extreme directional moves at this stage.
Medium-Term Breadth and Trends
-
Weekly and monthly trends support a generally bullish stance:
-
61.7% of stocks advanced over the past week, with only 37.3% declining.
-
On a monthly basis, a striking 88.6% of stocks are positive — the highest in this period — while only 11.2% are negative.
-
Three-month metrics are more mixed: while the majority have advanced (71.9%), only 3.4% gained over 25%, and 17.1% dropped over 25%, showing some pockets of weakness in longer-term trends.
Conclusion
The short-term market breadth has improved again after two weaker sessions, suggesting a rebound in bullish participation. Despite this, the underlying intermediate and longer-term breadth (SMA50+/100+/200+) remains weak, implying that many stocks are still in recovery mode. The market shows strength in the short term but needs broader support from more stocks breaking key moving average levels to sustain a longer-term uptrend.