
Technical analysis often relies on identifying stocks with strong underlying momentum that are simultaneously forming consolidation patterns, offering favorable entry points for breakout trades. This approach combines two key metrics: the Technical Rating, which assesses the overall health and trend strength of a stock, and the Setup Rating, which evaluates the quality of its current price pattern for potential entry. Stocks that score highly on both metrics are considered prime candidates for technical breakouts, as they represent strong trends pausing before potential continuation.
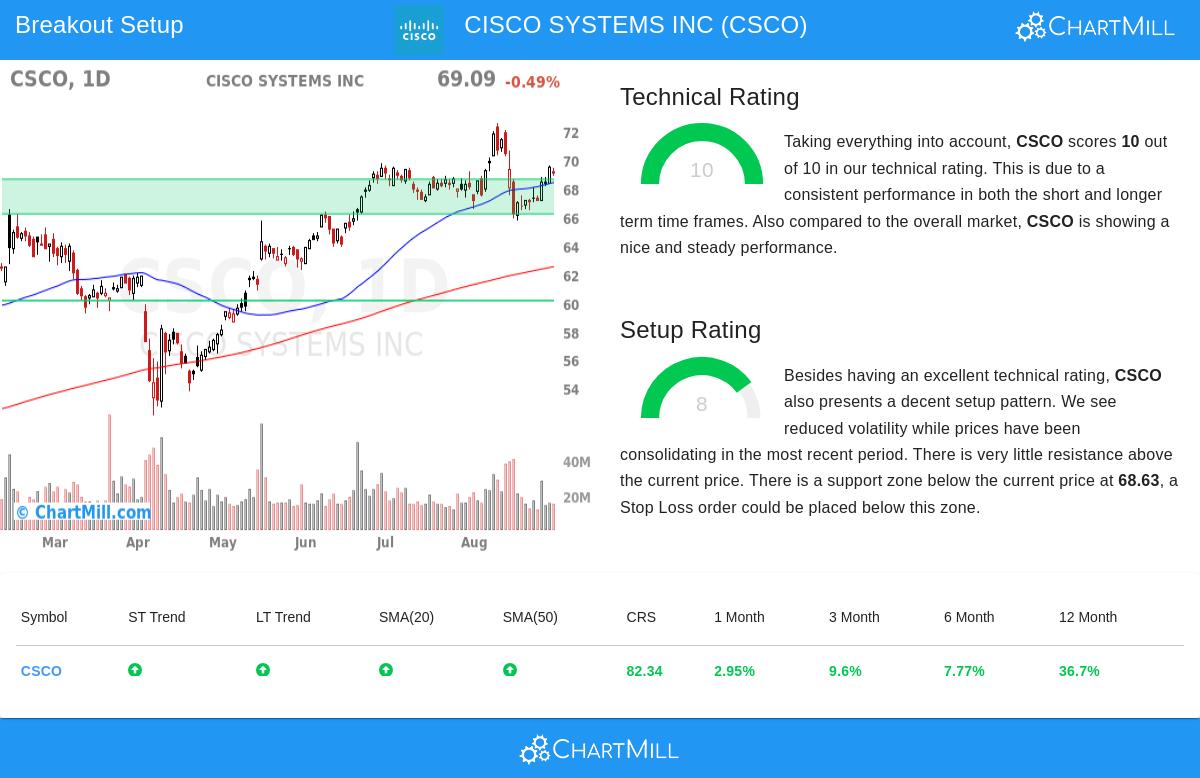
CISCO SYSTEMS INC (NASDAQ:CSCO) currently exemplifies this combination, with a perfect Technical Rating of 10 and a Setup Rating of 8. These scores indicate not only a powerful uptrend but also a consolidation phase that may precede another leg higher.
Technical Strength and Momentum
The Technical Rating of 10 places Cisco in the top-tier stocks from a momentum perspective. This score reflects strong performance across multiple timeframes and indicators. Both the short-term and long-term trends are positive, with the stock trading above key moving averages, including the 20-day, 50-day, 100-day, and 200-day SMAs, all of which are rising. Such alignment suggests sustained buying interest and trend strength. Additionally, the stock demonstrates superior relative strength, outperforming 82% of all stocks in the market over the past year. This is a critical aspect of the Technical Rating, as it helps identify market leaders that are more likely to sustain their advances, especially in a supportive market environment like the current one where the S&P500 shows positive short and long-term trends.
Setup Quality and Consolidation Pattern
While a high Technical Rating identifies strong candidates, the Setup Rating determines entry suitability. Cisco’s score of 8 signals a high-quality consolidation pattern. Recent trading has occurred in a defined range between approximately $65.75 and $72.55, with reduced volatility and price action tightening near the upper portion of this zone. This behavior often precedes breakouts, as it indicates equilibrium between buyers and sellers before a potential imbalance. The setup is further reinforced by a well-defined support zone between $66.20 and $68.63, formed through a confluence of trendlines and moving averages. This provides a logical area for placing stop-loss orders, managing risk effectively if the breakout does not materialize.
Risk and Reward Considerations
The technical report suggests a potential entry above $69.59, which would signal a breakout above recent resistance, with a stop-loss around $65.74. This levels imply a risk of roughly 5.5% on the trade, which is reasonable given the stock’s strong technical backdrop. It is important to note, however, that while the pattern appears promising, breakouts are not guaranteed. Investors should consider overall market conditions, sector performance, and company-specific news, such as upcoming earnings, which could impact price movement.
For those interested in exploring similar technical breakout opportunities, additional candidates can be reviewed using the Technical Breakout Setups screen, which filters for stocks exhibiting high ratings in both technical and setup quality.
Disclaimer: This article is for informational purposes only and does not constitute investment advice. All investments involve risk, and readers should conduct their own research or consult a financial advisor before making any trading decisions.