
When searching for quality dividend stocks, investors often use screening strategies that balance multiple fundamental factors. The "Best Dividend Stocks" screen on ChartMill finds companies with good dividend characteristics while keeping acceptable profitability and financial condition. This method filters for stocks with a ChartMill Dividend Rating of 7 or higher, confirming high dividend quality, while needing minimum scores of 5 for both profitability and health ratings to exclude companies with operational issues or balance sheet problems. This process helps find lasting dividend payers instead of only pursuing the highest yields.
Dividend Strength and Sustainability
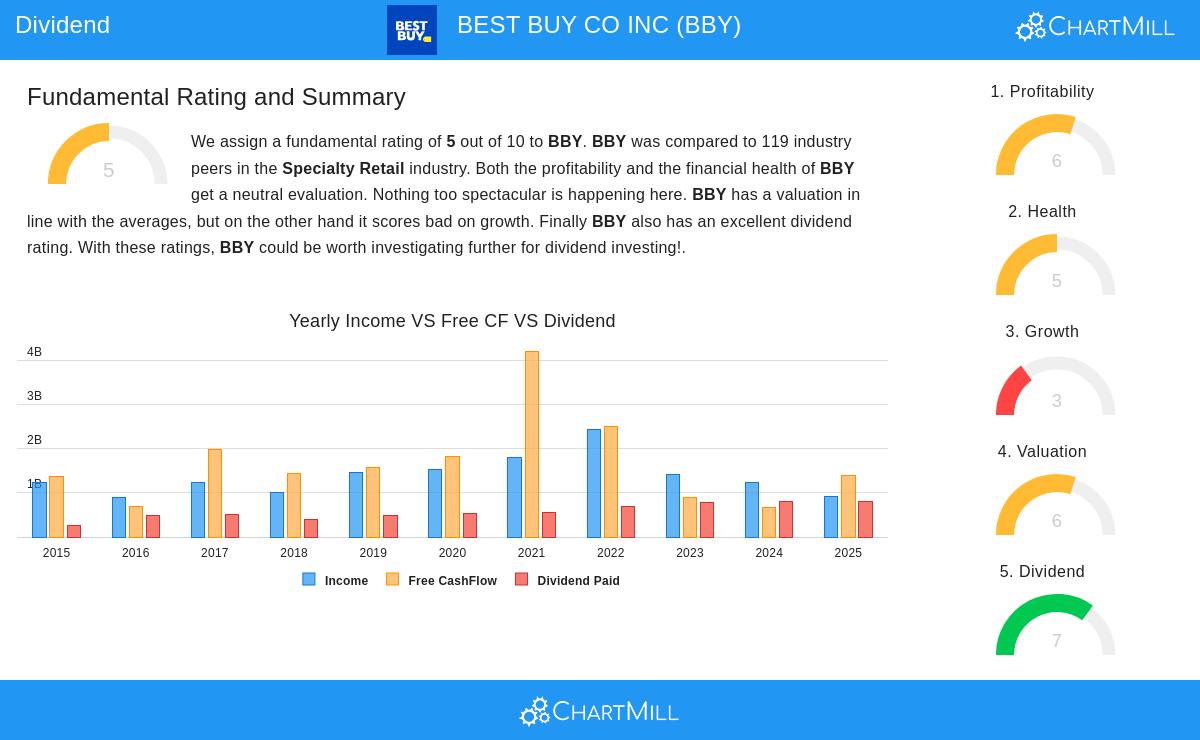
Best Buy Co Inc (NYSE:BBY) shows several positive characteristics for dividend-focused investors. The company's dividend profile displays both good current income and a history of dependable payments, which matches the screening criteria stressing dividend quality over only yield seeking.
Key dividend metrics include:
- Current dividend yield of 4.84%, much higher than the S&P 500 average of 2.34%
- Five-year average dividend growth rate of 13.38% each year
- Ten-year history of steady dividend payments without cuts
- Does better than 92% of specialty retail peers in dividend yield
These metrics show why the screening method favors dividend rating over basic yield by itself. While the high yield is positive, the steady growth history and dependable payment record give assurance about the continuation of income generation. The screening method excludes companies with irregular dividend histories, concentrating instead on confirmed payers with a shown dedication to shareholder returns.
Profitability Foundation
The company's profitability metrics support its capacity to continue dividend payments, which is important for the screening need of a minimum 5/10 profitability rating. Best Buy gets a 6/10 profitability score, showing enough earnings capacity to maintain its dividend program in spite of some margin pressures.
Notable profitability indicators:
- Return on Invested Capital of 19.01%, doing better than 87% of industry peers
- Return on Equity of 28.65%, placed in the top 15% of the specialty retail sector
- Positive operating cash flow kept up during the past five years
- Steady profitability over the last five years
These profitability measures are necessary for dividend continuation, as they show the company produces sufficient returns from its activities to pay for both business reinvestment and shareholder distributions. The screening method purposely leaves out very profitable companies dealing with margin decline, concentrating instead on businesses with stable earning capacity.
Financial Health Assessment
With a health rating of 5/10, Best Buy shows acceptable financial stability to handle economic cycles while continuing dividend payments. The screening need for a minimum health rating makes sure companies have enough balance sheet strength to endure short-term difficulties without risking dividend commitments.
Financial health highlights:
- Debt-to-Equity ratio of 0.43, showing balanced leverage
- Debt-to-Free-Cash-Flow ratio of 0.87, indicating fast debt repayment ability
- Return on Invested Capital is much higher than cost of capital, producing shareholder value
- Share count decrease over one and five-year periods
The health rating need in the screening process acts as an important protection against companies that might give up financial stability to maintain dividends. Best Buy's workable debt levels and strong cash flow generation provide a cushion against possible economic difficulties, supporting ongoing dividend payments during hard periods.
Areas for Consideration
While Best Buy satisfies the main screening criteria, investors should note several factors needing observation. The dividend payout ratio is now above 100% of earnings, although this might show short-term earnings weakness rather than long-term issues. Revenue has decreased a little in recent periods, although analysts expect a return to growth. The company's current and quick ratios show acceptable but not outstanding liquidity standing within the industry.
The detailed fundamental analysis report gives more information on these considerations and other fundamental factors that could affect the investment thesis.
For investors looking for similar dividend opportunities, the Best Dividend Stocks screen frequently updates with companies meeting these balanced criteria for dividend quality, profitability, and financial health.
Disclaimer: This analysis is based on fundamental data and screening methods for informational purposes only. It does not form investment advice, recommendation, or endorsement of any security. Investors should perform their own research and think about their personal financial situations before making investment decisions. Past performance does not assure future results, and dividend payments are subject to company choice and market conditions.