Apple Inc. (NASDAQ:AAPL) Meets Caviar Cruise Standards for High-Quality Long-Term Investment
By Mill Chart
Last update: Aug 12, 2025
The Caviar Cruise stock screener helps find high-quality companies for long-term investment, focusing on those with solid revenue and profit growth, good returns on invested capital, reasonable debt levels, and steady cash flow. Based on Luc Kroeze’s "The Caviar Formula," this approach highlights businesses with lasting competitive edges, smart capital use, and stable profits. Investors looking for quality prefer firms that can grow value over time, even if their prices seem high in the short term.
Why Apple Inc. (NASDAQ:AAPL) Meets the Caviar Cruise Standards
Revenue and EBIT Growth
Apple satisfies the Caviar Cruise minimum of 5%+ yearly revenue and EBIT growth over the last five years, with:
- Revenue CAGR (5Y): 6.2%
- EBIT CAGR (5Y): 14.0%
Notably, Apple’s EBIT growth exceeds its revenue growth, showing better operational efficiency and pricing strength—a sign of strong businesses. This matches the screener’s focus on companies that grow profits effectively, benefiting from scale or brand value.
High Return on Invested Capital (ROIC)
Apple’s ROIC, excluding cash, goodwill, and intangibles, is 76.1%, well above the 15% benchmark. This measure matters to quality investors because it shows how well a company uses capital to create profits. Apple’s outstanding ROIC reflects its leading market position, profitable services division, and careful capital management.
Solid Balance Sheet and Cash Flow
The screener favors firms with debt levels that match free cash flow (FCF). Apple’s Debt/FCF ratio of 1.06 means it could clear all debt in just over a year using current FCF—far below the five-year limit. Its five-year average Profit Quality (FCF/Net Income) of 111.3% also confirms earnings reliably turn into cash, reducing dependence on accounting adjustments.
Profitability and Margin Growth
Apple’s financials show rising margins and better profitability than peers:
- Operating Margin: 31.9% (top 3% of industry)
- Net Margin: 24.3% (top 3% of industry)
- Gross Margin: 46.7% (top 20% of industry)
These numbers, along with five-year growth in operating and net margins, suggest Apple keeps pricing control and cost efficiency—key for long-term value growth.
Valuation Notes
While Apple scores low on valuation (P/E of 31.3, above industry and S&P 500 averages), quality investors often pay more for outstanding businesses. The company’s 12.5% expected EPS growth and 6.2% projected revenue growth support some premium, though entry timing should be evaluated.
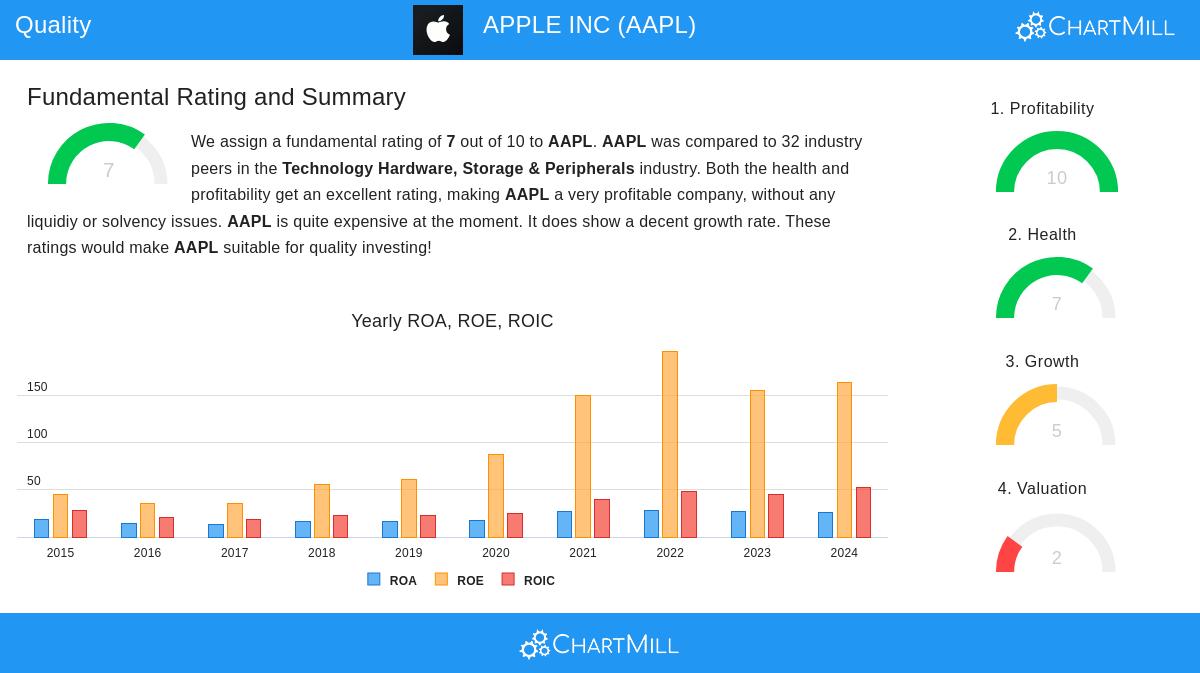
Fundamental Analysis Overview
Apple’s full fundamental analysis shows:
- Profitability: 10/10 (top margins and ROIC)
- Health: 7/10 (good solvency but higher debt/equity)
- Growth: 5/10 (slowing but still solid)
- Dividend: 5/10 (low yield but sustainable payout)
Finding More Quality Stocks
For investors searching for similar high-quality companies, the Caviar Cruise screener provides a selected list of firms meeting these strict criteria.
Disclaimer: This analysis is not investment advice. Investors should do their own research or consult a financial advisor before making decisions.
278.78
-1.92 (-0.68%)
Find more stocks in the Stock Screener
AAPL Latest News and Analysis