ChartMill Home Page
IWM/QQQ/SPY Market Charts
Symbol Search
Popular Symbols
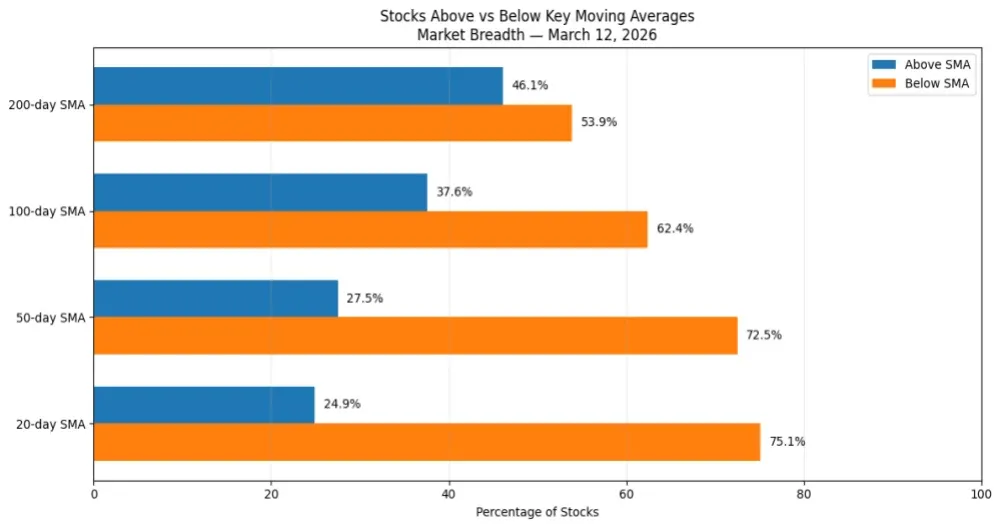
Market Today
Advancing
Above SMA(20)
Above SMA(50)
Above SMA(100)
Above SMA(200)
New High Vs Low
Market Monitor
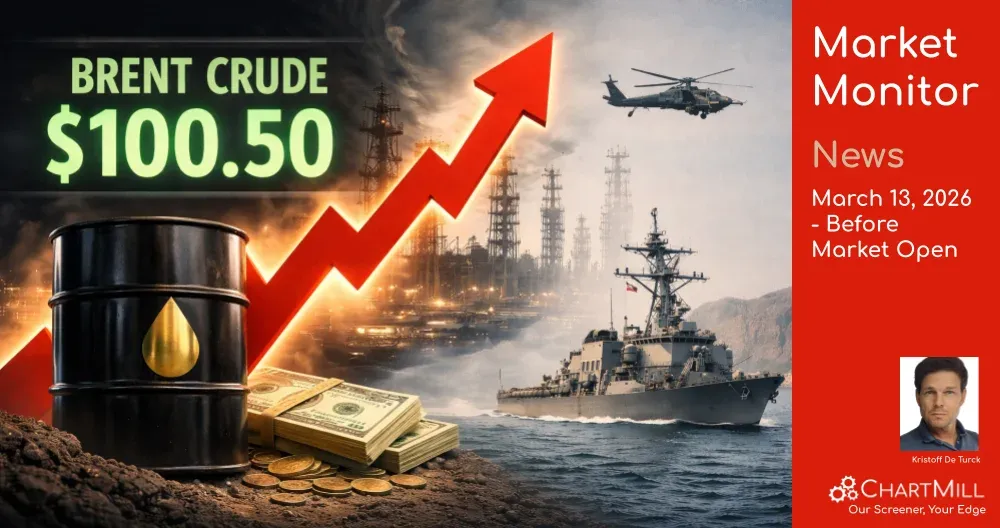
Market News
JSW Steel Wins Rights to Develop Coking Coal Mine in Mozambique
NHS and MoD will be urged to buy British tech to drive growth amid Iran crisis
China Travelers Make Record Number of Trips in Spring Holidays
Two LPG Ships Sail Through Hormuz on Way to Shortage-Hit India
Europe repaid Tokyo a favour by supporting oil stock release, Japan minister says


Discover: ChartMill Trading and Investment Ideas
ChartMill includes a large library of pre-configured stock screens designed around proven technical and fundamental criteria.
These screens are built on structured technical and fundamental metrics, allowing you to quickly identify opportunities while maintaining full control over your selection criteria.
O'Neill CANSLIM High Growth screen
Mark Minervini - Trend Template + FA Screen 6

High Growth Momentum + Trend Template

High Growth Momentum Breakout Setups
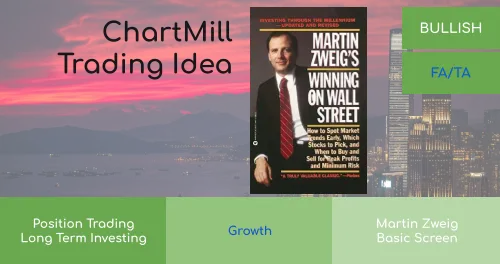
Martin Zweig: Growth at Reasonable Price
Strong Growth Stocks with good Technical Setup Ratings
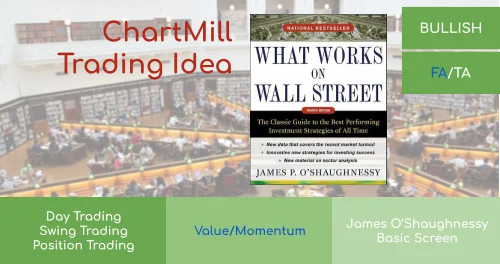
James O’Shaughnessy: Tiny Titans

Discover ChartMill
Advanced Stock Screener for Technical and Fundamental Analysis
ChartMill is an advanced stock screener and analysis platform designed for traders and long-term investors.
Filter stocks using powerful technical and fundamental criteria, analyze charts and financial statements, track earnings estimates and discover new opportunities — all in one integrated workflow.

Technical and Fundamental Stock Screener
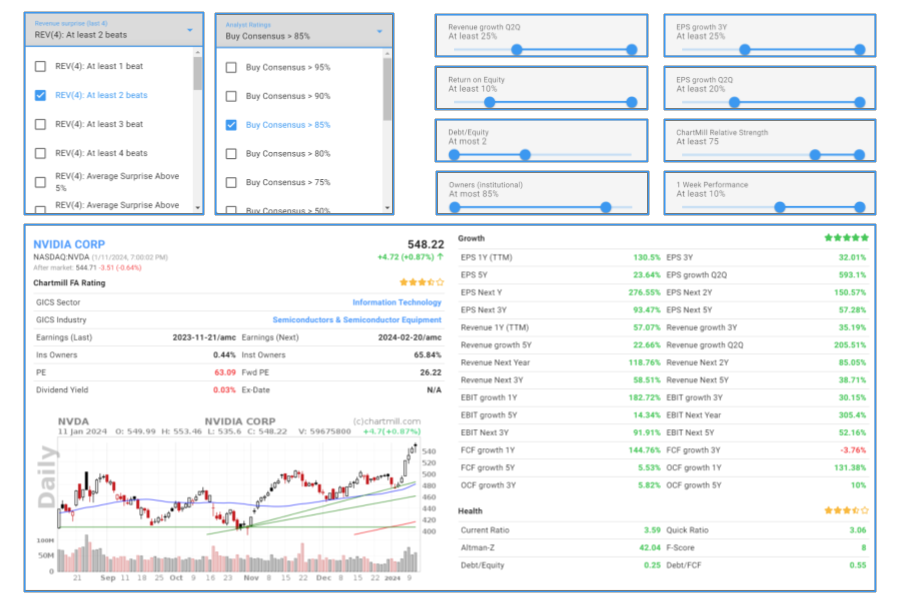
The ChartMill stock screener is one of the most advanced screeners on the market and is suited for a wide range of strategies. Whether you use Technical Analysis for short term day- or swing trading, Fundamental Analysis for long term Growth, Value, Quality or Dividend investing or combine both for Growth Position Trading, we've got you covered.
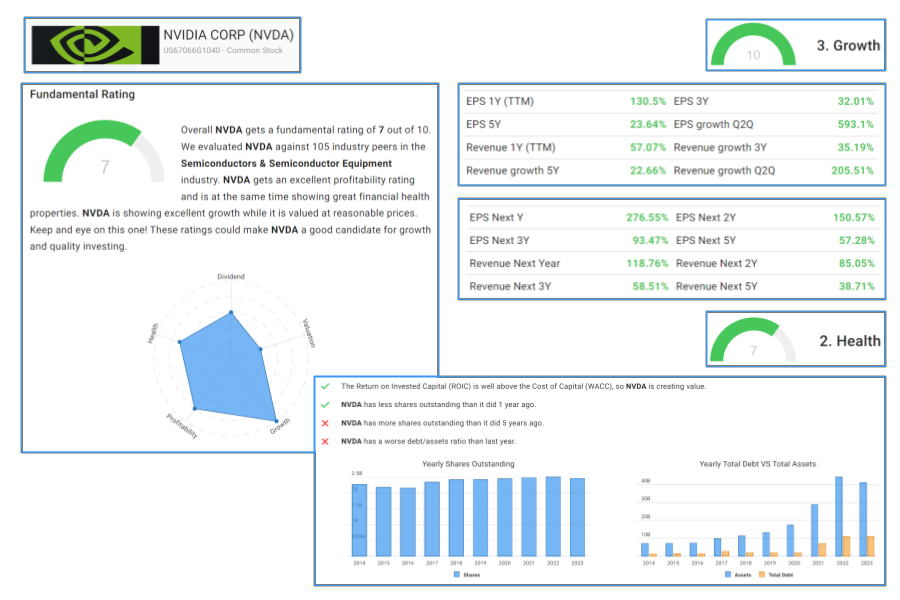
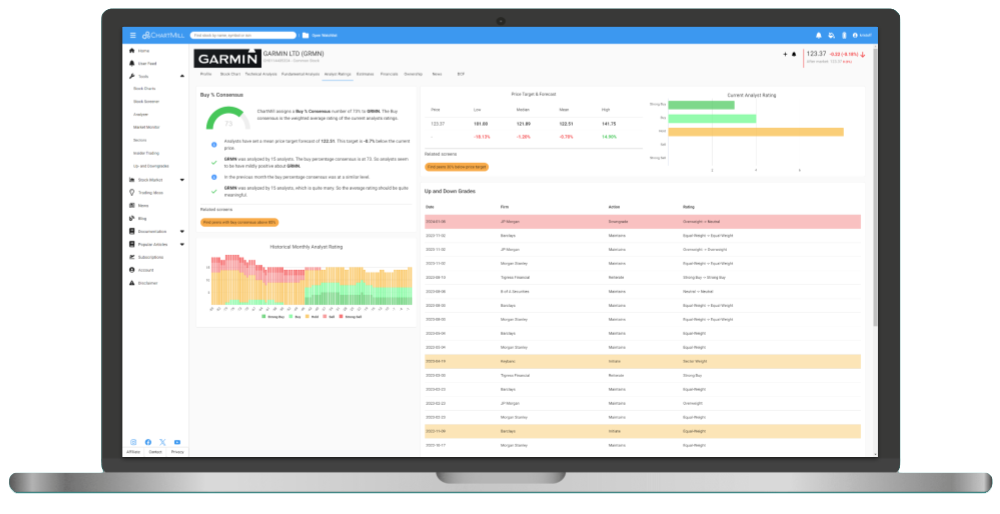
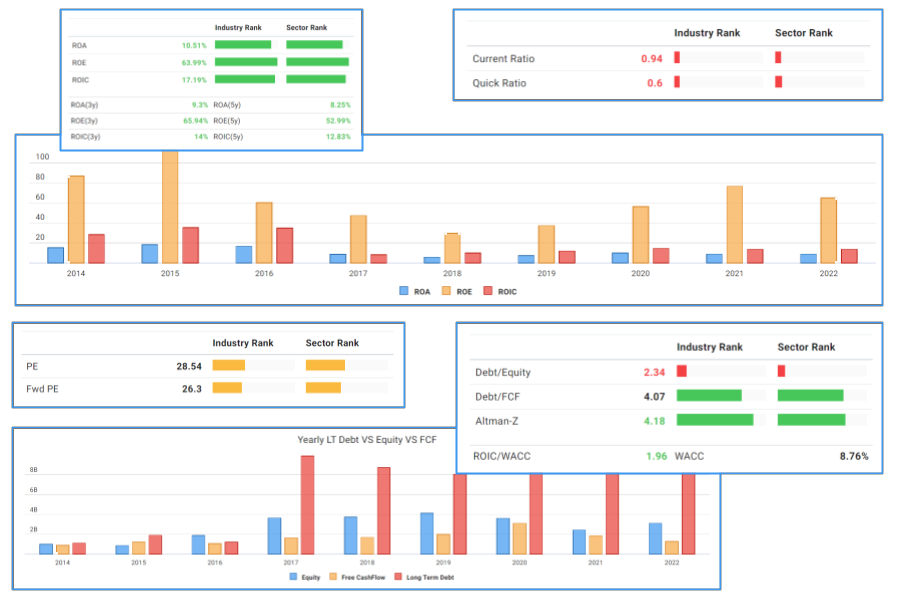
Fundamental Analysis Report
Every stock includes a comprehensive Fundamental Analysis Report, updated daily and structured around profitability, growth, financial health, valuation and dividend quality.
Proprietary ratings summarize each dimension, allowing you to quickly assess the fundamental strength of any company.
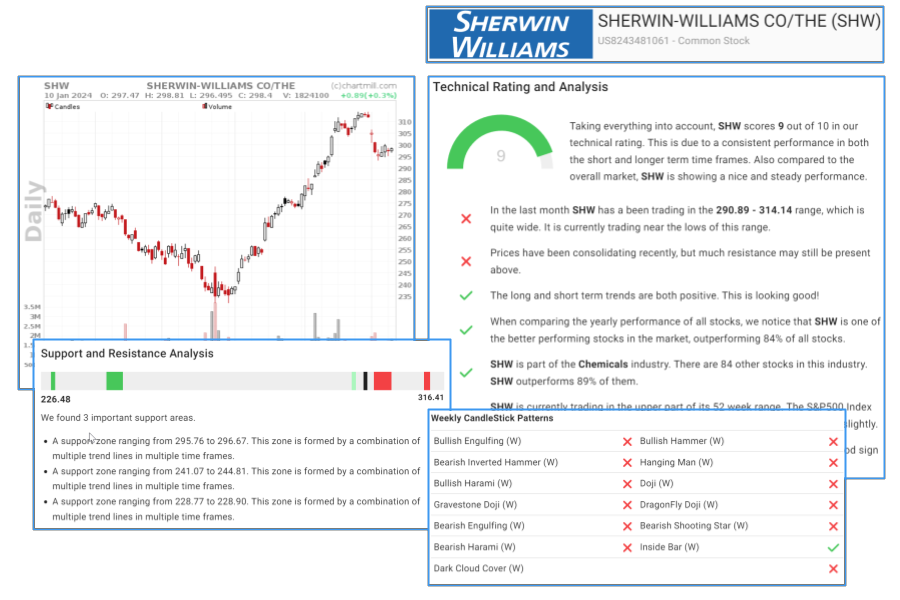
Technical Analysis Report
The Technical Analysis Report evaluates short- and long-term price trends, relative strength, support and resistance levels, and key chart and candlestick patterns.
A proprietary Technical Rating and Setup Rating help quantify trend strength and consolidation quality.
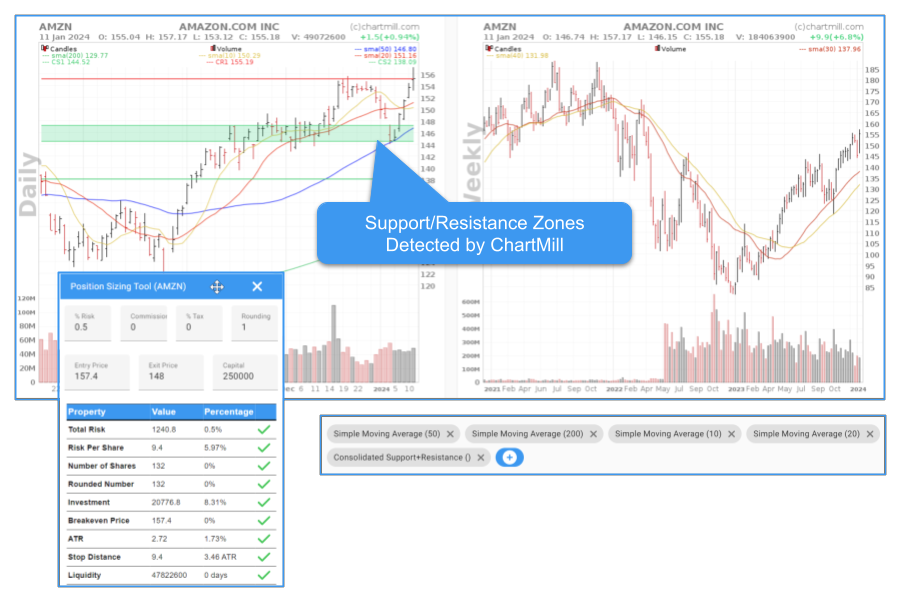
Advanced Stock Charts
Analyze price action with automated support and resistance detection and a wide range of professional technical indicators.
Annotate charts, switch to full-screen mode and use integrated position sizing tools to refine your trade planning.
Advanced Technical Metrics
- Relative Strength indicators
- Pocket Pivots and Effective Volume
- Support and Resistance Zones
- Chart and Candlestick Patterns
Advanced Fundamental Metrics
- Earnings Surprises and Estimate Revisions
- Growth Acceleration Metrics
- Industry and Sector Rankings
- Long-Term Profitability Metrics (ROA, ROE, ROIC)
- Piotroski Score and Altman Z-Score
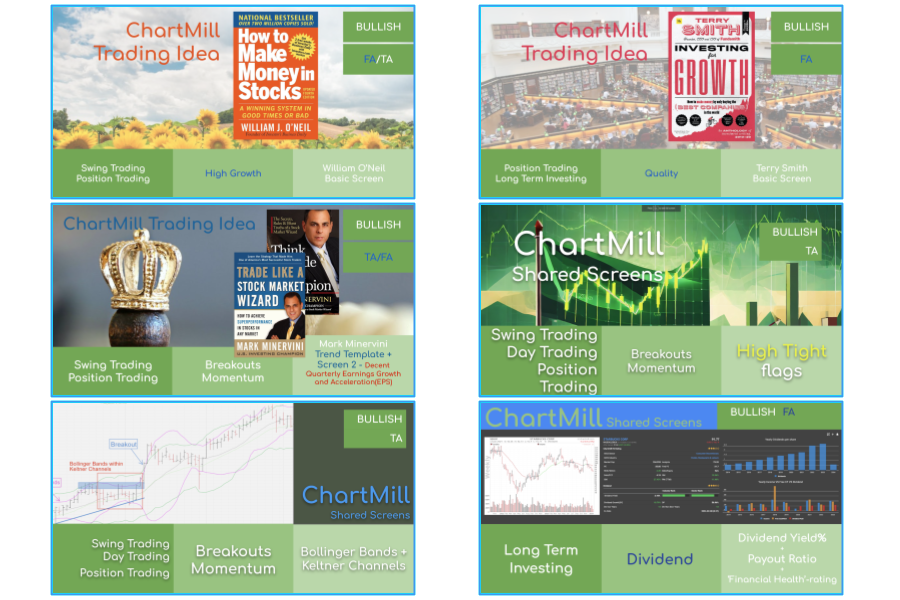
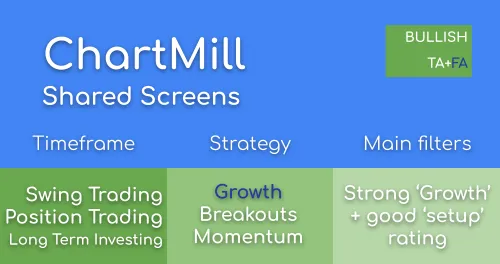
Pre-Configured Trading & Investing Screens
Access a large library of pre-configured stock screens based on well-known trading books and proven systems.
Combine technical and fundamental filters to build swing trading, growth investing or position trading strategies — and fine-tune them to match your own approach.

Learn and Grow
We want you to be successful with ChartMill. Explore our growing library of articles, videos and blog posts to sharpen your technical trading and fundamental investing skills.
Customer Support
Our founders each have more than 20 years of market experience and are always available to help.

Market and Sector Analysis Tools
Monitor overall market conditions with our market breadth tools and 10 years of historical data. Identify the strongest sectors and industries to align your trades with market momentum.
And much, much more ...
- Long Term Earning Estimates
- Analyst Ratings
- Financials
- News
- Custom Views
- Custom Filter Expressions
- Watchlists and Alerts
- Institutional Ownership, Insider trades and ownership
- Sector and Market Breadth tools
- Data export
- ...
Choose Your Investing Approach
Explore dedicated guides tailored to your trading or investing style: