TRADERS - Equity Curve Control - Part 4
Published on Chartmill with kind permission of TRADERS’ Magazine. Check the original PDF article here
Though technical analysis thrives on the premise that price and volume are the ultimate synthesis of all market information digested by all market participants, it is equally important for a trader to see the bigger picture of his performance in the long run. Handling each trade right is of course very important. But the weight of each trade on performance diminishes the more trades are taken. Or at least it should. This article series eventually goes beyond evaluating that performance and shows how it even can be controlled to a certain degree, by focusing on that bigger picture.
This series of articles has taken us on quite a trip. We took off discussing system dynamics and how this applied to financial markets. We saw how control engineering showed us not to change the internals of a system based on its output to try to steer it, but instead drive a system towards (more) profit by making the feedback based on performance, control money management of the system in a closed loop (see figure 1). Feedback becomes input instead of opening up the system’s internals for a trip back to the drawing board. Back testing induces ‘accidental’ system complexity and lets us indulge into curve-fit-yourself-rich (at least on paper, that is). The whole idea is to control a system by tuning its money management according to its profit performance, as given by the equity curve of the system, instead of tinkering with system rules in order to brush up could-have historical superb results.
All of this can be done on one system or, better yet, on an aggregate of simple and independent trade systems. What we called an ASITS for short. An EQA (equity curve analyzer) can adjust the risk taken for subsequent positions based on the current running success of the system. On a higher level an EQA can allocate finite resources to different non correlated systems, each using only a few simple system rules. It is on this higher multi-system level that an EQA really becomes an ASITS.
Hold your horses
To finish up things we are going to answer a few critical questions based on the thoughts and insights of readers and people whom over the years I explained the ASITS model to. After all this article series was written to provoke critical thinking. So please (re)read the previous articles so you can understand these questions and their answer well, and put them in the right perspective.
FAQ
Not so fast there. To start off, you are turning the system on and off based on hindsight.
That’s right. Every kind of analysis only can measure data from the past. Fundamental analysis, technical analysis, you name it. But at least this is a second order analysis through which the system itself never gets altered. Changing the system based on past results will almost surely make it more complex and less robust without equity curve analysis, than it would have been with EQA. So it’s not so much a matter of equity curve analysis not being perfect but rather it being the better alternative as opposed to tinkering with the system based on its past performance. After all, two people don’t have to be able to outrun a lion. One being faster than the other will make the difference.
You still can’t detect a dip before it happens, but this probably is a far more efficient way of measuring it, both in speed and effort, while doing so. And this works both ways, because with my trend following strategy, very often I can see the market turn before that’s clear to most people just looking at some index. As such the last paper trades of every cycle might work as a leading indicator to the whole market. Especially when you start monitoring the different systems in an ASITS and their correlation. Paper trades start showing profits early and valuable setups start increasing as a kind of market breadth indicator. As a bonus you are not only getting a sense of the market but more importantly a state of synchronicity of your system with the market. Because, after all, if you are right and the market isn’t, you still aren’t going to make money. You could call this measure the resistance of the market to the system (or the other way around).
Isn’t all this based on the hypothesis of the existence of streaks of winners and losers?
An important remark, really. As with trends, there’s no logical reason, nor empirical evidence denying the existence of streaks, yet plenty of proof to the contrary. Any system, as the market in itself is, is governed by rules and based on the order of, in time irrational, people. Besides that, markets are cyclic as they are a resultant of nature (and life). So logical systems based on market dynamics will continue working and stop working in a never ending cycle. Exactly because of logical build systems going in and out of synchronization with markets, they will tend to have streaks of winners and losers. And, as such, trend of increasing and decreasing performance. Starting from this insight, EQA is just aiming at draining money from the system when performance decreases as proof of the system getting out of synch. Keeping the drawdowns of any logical plausible system small instead of trying to build an elusive system that always works.
Isn’t this de ultimate form of self-deception as you are superimposing curve-fitting?
Well, that depends on the complexity of your strategy. If your degrees of freedom are small already, adding another (equity curve, moving average or whatever) will not be a big deal. But you can still commit the curve-fitting sin, because, after all, your still using technical analysis but on another level (that of system performance output).
Perhaps we didn’t stress this enough throughout the articles. Simple systems based on a conceptual idea of market dynamics and expectancy are the most robust ones (which doesn’t mean they won’t go out of synch, but they most probably will get back into synch). On the higher level of equity curve analysis, the same rules apply. Keep it simple. Using a volatility based trailing stop already gets you a lot of the benefits with the least amount of work and a negligible chance of curve-fitting.
It’s also important that you know how your system will behave in every market type and any changes between them. For instance, trend following strategies will give back money when a trend turns and will slowly bleed to death in a trendless market. Besides that, if you use different systems, errors on both sides will neutralize each other. To fully exploit this, search for systems with non-correlated equity curves and few but simple rules based on conceptual logic about the market instead of looking at the statistics of back test results. EQA is no substitute for common sense, but rather a consequence of making use of it.
Paper trading doesn’t make me money and takes emotions out of the picture leaving us with a whole different ball game.
Paper trading seems pretty useless to many traders exactly because it puts emotions out of the picture. However it can be very useful in equity curve driven money management. The system switches between live and paper trading, it doesn’t stop trading completely. So paper trading here, is rather about mechanical follow up and technical supervision than it is about mental learning.
As to the part where paper trading doesn’t make you money. There’s a beautiful solution in searching different strategies or systems that aren’t correlated. So at any time one of the systems might outperform (measured by its equity curve). Your equity can be directed to a system that’s working at the moment or it can be divided amongst different systems based on (or weighted by) their relative performance. That way, exposure risk gets avoided and opportunity cost is countered at the same time. The beauty of this, is that you can stop searching for new systems after a while and just regulate money flow between the existing ones, based on their equity curves.
Last but not least, this might cause opportunities being missed.
Right on the spot. When trades aren’t taken live, the switch to live trading again will almost certainly imply missing the first (or even several) winners. And that might be a big winner. Big winners, however, might be very important for systems with a low reliability such as trend following. This might be the price you pay to for getting lesser draw downs in return. However, every big winner will be a small winner first. So a paper trade winner triggering the system back to live trading could be stalked for a new entry (as a failsafe valve in the control loop), no matter what the actual system dictates.
As a second solution to lessen this problem, paper trading can be seen as the most extreme option of various degrees of risk management. As a consequence, the more the system stagnates and finally the more it deteriorates, the more the %risk is cut back, possibly all the way to down to 0% (i.e. paper trading). But one could also stop the cut back at, for instance, 0.15% risk, never actually going into paper trading.
Conclusion
Apart from the advantages of equity curve controlled usage of a trading system mentioned throughout these articles, there’s more. A trader stays in touch with the bigger picture. In the end successful trading is all about expectancy, risk management and position sizing. By incorporating equity curve analysis and control, a trader becomes more goal-oriented, focusing on making good decisions, rather than on having isolated good results as measured by the particular outcome of any one trade.
Protecting equity while still sticking to the system can build a lot of trust and more efficient use of resources. For instance, when your system is paper trading you keep seeing how much money you might have lost, feeling good even when the system performs badly, directing all of your time to study or the search for other not correlated systems, instead of loosing time tweaking the system at ‘rest’. Furthermore, any system failing might be an opportunity to find a possible short system as some swing-counterpart of the failing system. So if a system fails, your first question shouldn’t be ‘why has it stopped working’, after all we only call it being temporarily out-of-sync remember. No, the right question is, how can I make money on this failing system without considering changing it. The answer very often lies in building a new system in the opposite direction which then might be added to pool. This could be as simple as taking trades in the opposite direction (but usually this is rather a starting point than a full-fledged system). After all, this would suggest that you've potentially determined a method for systematically deciding on the market condition, and there is no reason why that shouldn't be exploitable in a way.
In the end, EQA lends itself to objective trading and extensive automation, saving a lot of time and energy on the overrated analysis part of the trading equation.
[FIGURE 1]
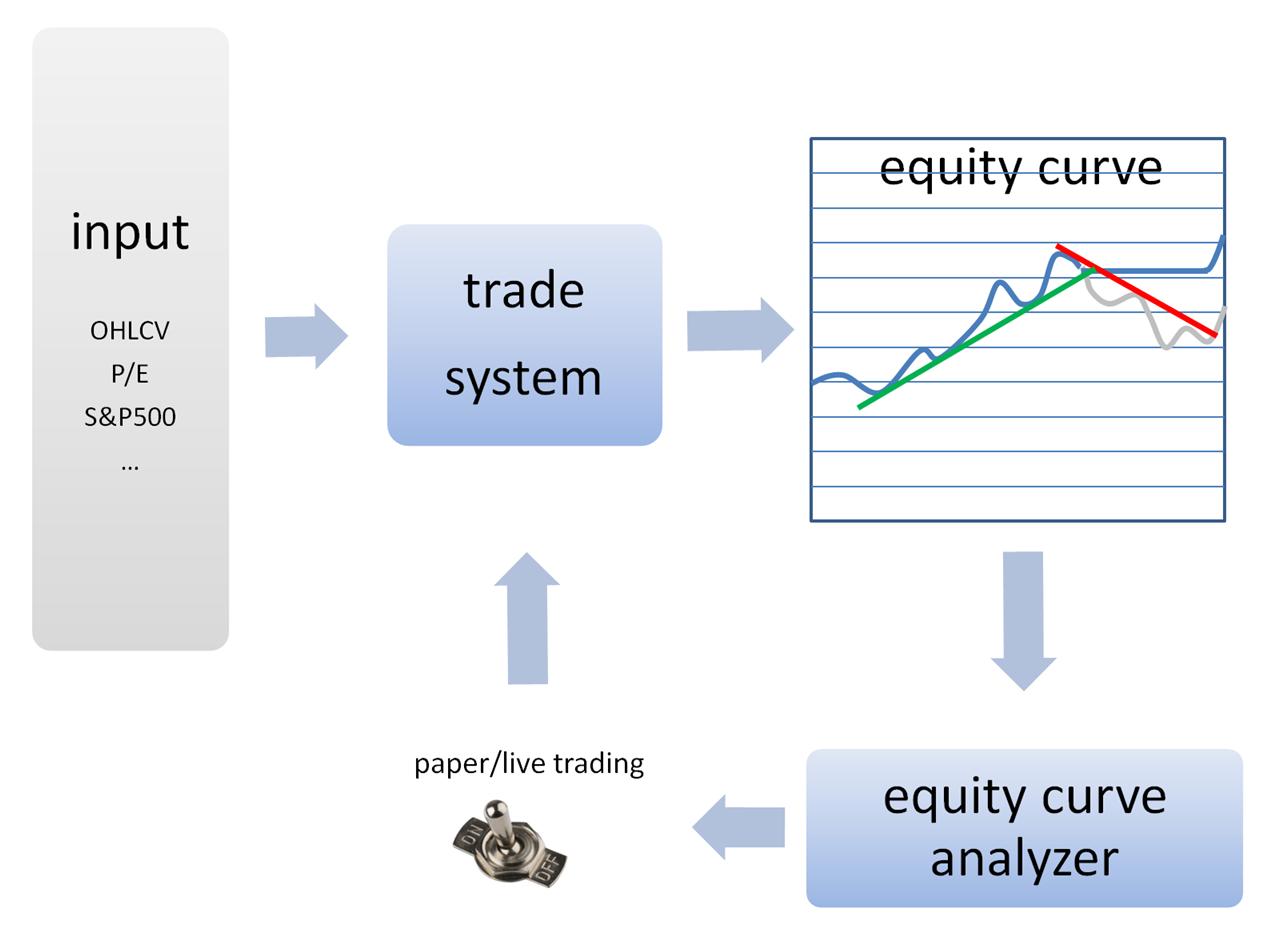
[HEAD] Equity Curve Control feedback loop
[CAPTION] Figure 1: The equity curve at the output of a system is analyzed. Based on this equity curve analysis, the system trades live or on paper (to be able to continue measuring a theoretically paper equity curve). The theoretically ‘paper’ equity curve is shown in gray, the real equity curve is blue. As soon as the system starts ‘working’ again, live trading is resumed.
DIRK VANDYCKE is actively and independently studying the markets for over 15 year, with a focus on technical analysis, market dynamics and behavioral finance. He writes articles on a regular basis and develops software, which is partly available at his website www.chartmill.com. Holding master degrees in both Electronics Engineering and Computer Science, he teaches software development and statistics at a Belgian University. He’s also an avid reader of anything he can get his hands on. He can be reached at dirk@monest.net.