TRADERS - Equity Curve Control - Part 1
Published on Chartmill with kind permission of TRADERS’ Magazine. Check the original PDF article here
Though technical analysis thrives on the premise that price and volume are the ultimate synthesis of all market information digested by all market participants, it is equally important for a trader to see the bigger picture of his performance in the long run. Handling each trade right is of course very important. But the weight of each trade on performance diminishes the more trades are taken. This article series eventually goes beyond evaluating that performance and shows how it even can be controlled to a certain degree, by focusing on that bigger picture.
Every person or institution trading, or investing in, financial markets, uses a system. Or even many different systems. Some systems are totally automated. Others are almost fully discretionary. In which case we’d rather call it a strategy (what’s in a name †). Some people wouldn’t even be able to begin describing their system, when asked. But even someone just chasing hot stock tips, actually is using a system.
Some put heavy weight on up front analysis of the system they use, or are about to use. Putting in a lot of intelligence, rules and adaptability. Going as far as optimizing parameters, while back testing and fine-tuning them before putting them to the final test of forward testing. Others don’t even have a clue what system they are using, as they might well be switching around different systems without even knowing. Then again, mixing systems is, again, a system on its own.
Every system has input it’s using, usually based on some form of analysis of raw data, fundamental and/or technical, to produce output in the form of when to buy or sell how much of whatever financial product, a.k.a orders.
† In this article system is also used as a synonym for strategy. The whole of decisions used and/or necessary to actually trade.
Danger ahead
The main problem most traders and investors are struggling with, is the fact that systems go in and out of synch with the market. This problem is most often recognized in a far more familiar way of searching for a system that withstands the test of time. The holy grail system that keeps on working in every kind of market, from commodities over stocks to forex, but also through every type of market, volatile sideways markets as well as steady and quiet bull markets. You name it. Oh and while we’re at it, let’s aim for a reliability of at least 80% winners.
How do we know this is a problem until this very day? Because new ways of analyzing market data are kept being invented. Timeframes are still getting smaller in search for an edge while satisfying mainly the illusion of control. Software to build systems gets more and more powerful (and complex), implying it also continues to be sold. Why bother writing more features and new software, if it’s not going to earn you money. This frequently ends in what is called ‘feature-bloat’ in software slang. Creating a situation where 80% of its users only use 20% of its functionality.
How do we know such a one-size-fits all system, really is a myth (hence the reference to the holy grail). Simply because of plain old system dynamics. Such a system would be adopted by more and more users, without anyone dropping out of a system that keeps working. In the end this would lead to system instability, ultimately ending the financial system as we know it. In reality just the supposed holy grail system stops working, or at least deteriorates. As long as there are financial markets, they are the living prove such a system cannot and does not exist.
The real danger in search for such a holy grail system is that systems, in the process, more often than not get curve fitted on the test data they see by adding more and more constraints. Systems thus get more complex while trying to make them more robust. Ironically enough, the added complexity is the force pulling us away from robustness. Again simple system dynamics explains why. The biggest part of the output of a system (here the robustness of a trading system begin build) can be reduced to a minor part of its input (here the rules and complexity). Even world famous strategies exist who got entangled in rules that don’t seem to change their robustness or even their profitability. Dead weight rules, after all.
The proof is in the pudding. Take a very famous system like CANSLIM. It has concepts, like its ‘cup-with-handle’, which couldn’t possibly be defined in a objective, algorithmic way. Which in turn means, if it can’t be defined in an objective, algorithmic way, it cannot be tested nor can it be measured. Hence its impact on the system as a whole can’t possibly be known. But when one drops the concept of a cup-with-handle from the system completely, the system keeps working, showing no measurable long term difference. This in turn makes the case for unnecessary system complexity keeping a strategy form reaching its full potential. Perhaps in performance but certainly in terms of percentage of time it’s working (i.e. making money).
In fact on www.chartmill.com, one of the developers succeeded to match the IBD100 list, which is based, among other things, on fundamental data, by more than 80%, just by using technical information like relative strength. Moreover, the real IBD 100 seems to lag the synthetic IBD100, without using any fundamental information at all.
The second most dangerous consequence of not finding a robust system, if not curve fitting a strategy announced dead, is traders starting system hopping. They declare a system’s dead, loose interest and start looking for another one. The truth is a once working system (ok if it’s not merely based on a technical arbitrage) never dies. It merely runs in and out of synch with the market. How do we know that for sure, you ask? You guessed it. System dynamics. The better a system works, the better and more it gets adopted. The more it gets used, the more signals get anticipated sooner while also closing the window of opportunity more quickly, resulting in less profitability because not every anticipated signal turns out to actually be a signal. In the end performance starts declining and people leave the strategy. This is exactly where the seed is planted for the system’s performance to improve again. When figuratively nobody uses it anymore, chances are it’s going to start working again. A system based on simple rules extracted from the logic of market dynamics, has no reason whatsoever to stop working permanently. Just as there always will be sunshine after rain and rain after sunny periods, there will be times a system is in synch and out of synch with the market. We can’t just throw away those diamonds in the rough. Perhaps we should merely exchange them temporarily with systems that are working at the very moment, only to reuse them as soon as they start working again, perhaps pushing the system(s) they got exchanged for, in turn, to the background. This implies we keep monitoring systems that currently are out of synch (and thus not traded live).
A very know example of this is trend following. This strategy gets declared dead in every sideways market, though it keeps coming back letting people reap lots of profits when trends reappear, time and again, decade after decade.
How can we avoid these dangers while still asserting ourselves that a system is working. Or better yet, how good it is working at any moment in time. In the end, all we need to know is when to use a system, when to stop using it, and when to start re-using it. We don’t have to abandon a system, we just have to put it on hold when it gets out of synch with the market. Chances are the system will start working again in the future. How do we know when? Simply by keeping it monitored while it’s hibernating.
It should be clear by now that the answer isn’t in changing or tweaking the system. How do we know how good a system or strategy is working? By looking at its output. Does it make money?
Side dish
I mentioned system dynamics a few times. System dynamics is the behavior of a (complex) system over time. It tries to relate the output of a system to its input, without knowing the exact internals of the system itself. Hence the connotation of a ‘black box’. Strange enough, the ‘black box’ description, seems the exact reason for a lot of skeptics towards objective, algorithmic system trading. Those opposed to the idea that you can study a system without knowing much about its inner workings, however, seem to use the same thing they call an unpredictable black box, as a crystal ball.
What makes using system dynamics different from other approaches to studying complex systems is the use of feedback loops and stocks and flows. These elements help describe how even seemingly simple systems display baffling nonlinearity. So far for fundamental analysis, and the many strategies based on the assumption of linearity and implied predictability, handled with extrapolation. Take the NAIC method as an example, here.
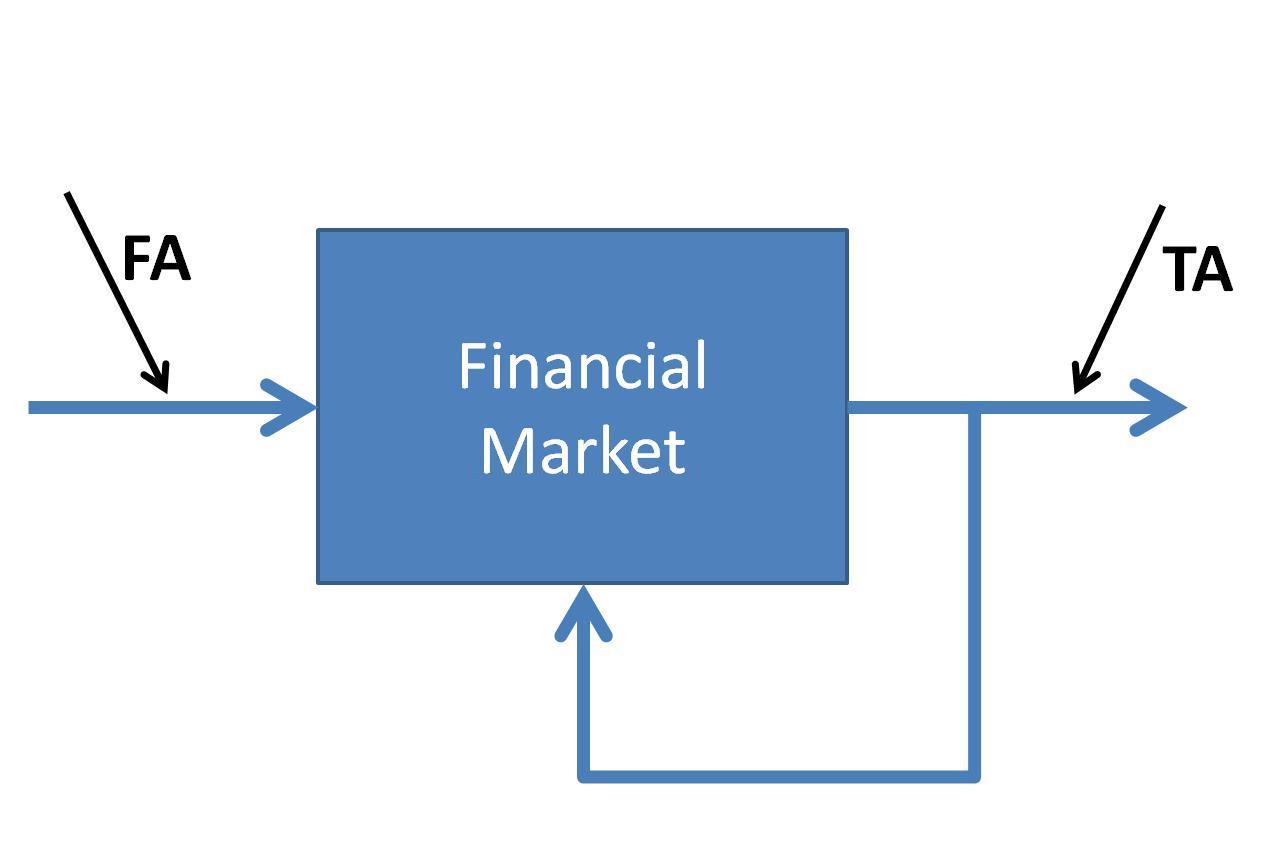
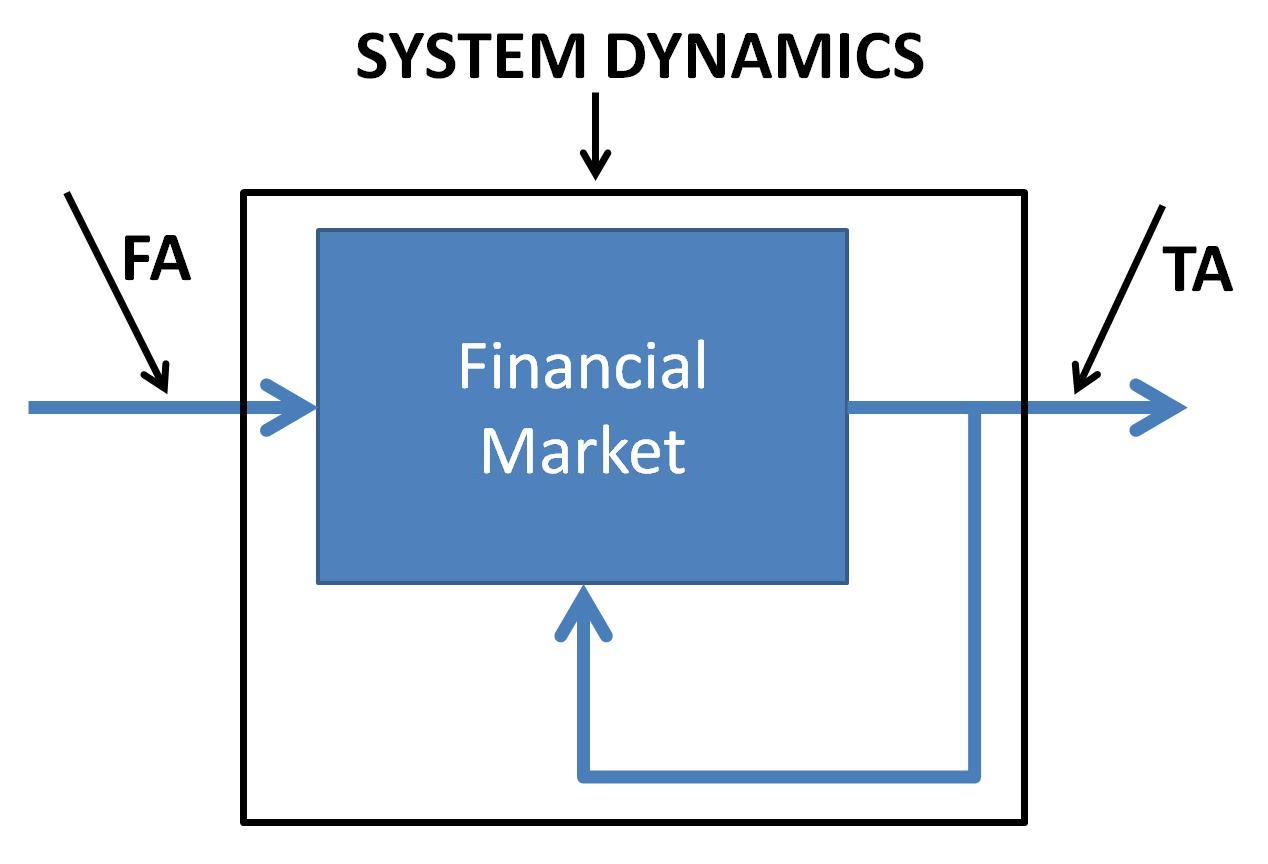
Consider figure 1, where we have a financial market depicted as a black box (a blue one really J). There are a lot of fundamental and economical powers steering the system. At the output we have moving prices and volume data (ok and bid/ask, open interest, and so on …). Now, while there’s a lot of discussion between proponents of fundamental analysis and technical analysis worshippers, they are in fact doing the same thing: crunching numbers. Only on both sides of the same spectrum. Fundamental analysis is measuring the input in the hope to learn about the system and to predict it’s reaction to the measured input. Perhaps that’s where the illusion of control originates. Technical analysists, on the other hand, measure the output of the system and react to it. But in their reaction, by placing orders, they also influence the system, which is represented by the feedback loop in figure 1. To cope with this feedback loop, which we also don’t understand, nor are we able to quantify it, we need to add the feedback loop to our definition off the system. As is superposed in figure 2.
Conclusion
We cannot improve a black box, by tinkering with the way we measure its reaction (output) to a stimulus (input) and curve fitting our instruments. Neither can we afford to measure the output as a means to reaction, without regards to the feedback of this same output back into the system. People react to prices, reacting to people, reacting to prices, reacting …
If we cannot know how the system is defined, simply because of limited analytic resources as opposed to the complexity of the system, the only thing we can do is measure its reaction in output to a certain input and make a controller to dampen the system’s effects and the effects of the input on the output. But that will get us most of the original degrees of freedom without the analytics complexity.
Coming up next
In the next article of this series, we’re going to explore the concept of equity curve analysis. Starting by tracking the performance of a system rather than tweaking the system to change its performance. This will keep our systems from complexity and the danger of getting curve fitted.
But it also will keep us from hopping from one system to another, loosing track of good systems that stopped working temporarily.
[FIGURE 1]
[HEAD] Financial Markets System Dynamics
[CAPTION] Figure 1: Financial markets as seen from a system dynamics viewpoint. Fundamental analysis measures the input of the system to predict its output. Technical analysis (at least the non predictive, objective, kind) looks at the output as to decide what to do.
[FIGURE 2]
[HEAD] Financial Markets System Dynamics
[CAPTION] Figure 2: To cope with the internal feedback loop, where the output (prices) influence the system, we have to include the feedback loop into our definition of the system (black box), as we do not exactly know the exact impact of this feedback in relation to the system output.
DIRK VANDYCKE is actively and independently studying the markets for over 15 year, with a focus on technical analysis, market dynamics and behavioral finance. He writes articles on a regular basis and develops software partly available at his website www.chartmill.com. Holding master degrees in both Electronics Engineering and Computer Science, he teaches software development and statistics at a Belgian University. He’s also an avid reader of anything he can get his hands on. He can be reached at dirk@monest.net.