TRADERS - Equity Curve Control - Part 3
Last update: Apr 19, 2024
Published on Chartmill with kind permission of TRADERS’ Magazine. Check the original PDF article here
Though technical analysis thrives on the premise that price and volume are the ultimate synthesis of all market information digested by all market participants, it is equally important for a trader to see the bigger picture of his performance in the long run. Handling each trade right is of course very important. But the weight of each trade on performance diminishes the more trades are taken. Or at least it should. This article series eventually goes beyond evaluating that performance and shows how it even can be controlled to a certain degree, by focusing on that bigger picture.
In the first article of this series we talked about system dynamics and how it relates to financial markets. How tuning a system by definition consequently changes it, making any conclusion about the tuned system practically worthless with regard to the original system. After all, it’s curve fitting. The basic premise we came up with, was that it will likely be better to view the system as an unchangeable black box, using external performance indicators to measure the quality of that system. In the second article we introduced several possible indicators to both quantify and qualify an system. A honorable mention goes out to streaks (the clustering) of winners and losers as a possible quality indicator of the system. We also introduced the concept of an equity curve, giving us the evolution of system equity throughout time. This article tries to exploit the equity curve to the fullest, using it to control the systems output without knowing or tinkering with its internals.
Control engineering
To control the system without knowing anything about the rules it encloses, we’ll take a control engineering approach. Take a very familiar example like a thermostat in a central heating system. As a temperature-sensitive automatic device that regulates and keeps the temperature within determined limits, it can be developed and used without any knowledge about any part of the heating system at all. All it does is combine a plain old thermometer with an switch to turn of the heating when a temperature is reached and switch it back on when the temperature drops below a certain threshold. There is not intervention of the controller in the systems internals. The whole system is just switched on and off, based on some external measurement of its performance (the temperature).
If the equity curve is the output of the system, than we can use this output as a feedback to the system itself. This is where the magic starts. Feeding back the output to the system to control it, is what control engineering is all about. In daily live we have tons of applications of this principle. And very often the controller itself is just a person. A computer mouse, for instance, is far from a precise instrument. The user actually is the controller, continuously adjusting over- and undershoot while trying to minimize aiming error. Take a car with a driver wanting to adjust to the speed limit. He reads his speed and starts controlling the system with his brakes if necessary. The driver is the controller.
For a trading system the same goes. We measure the output through the equity readings and use our brakes and gas pedal accordingly. As we do not want to change the system or its rules, we are going to adjust the % risk taken per trade, based on the equity curve. In its most basic form we can stop live trading and switch to paper trading if equity is going down.
Such a feedback/control loop for a trading system is depicted in figure 1. To avoid changing the systems internals we have to take total abstraction from it, viewing it as a closed black box that receives external inputs from whatever sources (fundamental, technical, really any possible input at all). The second abstraction step is decoupling the system’s input from its output. We will measure the systems performance only by its equity curve, or some other performance indicator which we’ll analyze. We discussed some performance indicators in the previous articles of this series.
The equity curve analysis can be done manually (i.e. subjectively) or mechanically, by an algorithm. Now, this analyzer acts like a process controller steering the system it tries to control. And just as a classic process controller, our equity curve analyzer will switch the system on and off, based on its performance. The controller knows nothing about the system or its the rules that lie within. It only switches the system on or off based on its performance. The system in turn knows nothing about the external controller, nor about the fact that it is turned on and off based on its performance. It just gets the signal to stop or resume trading from the equity curve analyzer.
At this point a deadlock problem occurs. If a system gets switched off, it can’t trade anymore. If it can’t trade anymore, it can’t generate trades and a performance flow. No performance means a flat equity curve, disabling our equity curve analyzer to switch the system back on. This is where paper trading comes in.
Paper trading
Paper trading is the act where a trader pretends to trade a virtual account and records everything as he would do with a real account. It’s a different kind of discipline to a trader, because all emotions are taken artificially out of the picture. Nevertheless one has to maintain discipline to keep recording (and not resetting or ) the virtual account. Brokers often provide paper trade accounts.
One place where paper trading shines is back testing. Remember though, what we said about back testing in the previous article. Strange enough, the same technique of paper trading comes to the rescue in this possible alternative to back testing we are discussing here.
The paper trading is necessary as we must be able to keep measuring our (now theoretical) equity curve. To see what would have happened if we continued taking trades live through the system. We resume live trading as soon as this theoretical equity curve starts going up again. As such, the real (adjusted) equity curve becomes dampened, guarded against too large a drawdowns. This whole cycle is shown in figure 1. The results on an actual equity curve are shown in figure 2.
Building an EQA
The Equity Curve Analyzer (EQA) might seem to be the most important and intelligible part of the whole control system. As analysis of the characteristics of markets and financial products shift to an analysis of their performance. But in reality such an EQA, like most process controllers, can be and better could be kept very simple. Possibilities are endless. One could build an EQA based on trend lines, moving averages (of the equity curve of course), or even a simple volatility adjusted Alexander filter stating to switch between live/paper trading whenever a retracement of the equity curve exceeds a certain ATR(°) multiple from a record top or bottom. Mainly just like the principle behind a volatility based stop loss such as the chandelier exit described by Alexander Elder. Any technical analysis used on price charts (first order) can potentially be used on the equity curve (second order).
The most conservative approach in forward testing is to initialize the EQA with a paper trade state. A such the system has to prove its worth from the beginning, even before it can even start trading live.
EQA aggregation
The whole point of building an EQA and deciding how complex it should be, can be taken yet one step further. First, there’s the idea of an EQA being discrete, switching the system on/off in a very rigid all or nothing way. In a continuous version of the EQA idea, a controller could turn the tap giving the system more or less money, based on its recent performance. As such, the amount of money given to a system, or percentage risked on any trade, could range over a [0,1] interval. Zero being the prohibition of live trading and one being able to trade or risk the maximum amount.
Next, one could aggregate a set of very simple but non (or low) correlated trade systems. By multiplexing its money to the best performing systems, deriving the worst performing systems at each moment from live trading possibilities. But ever still monitoring each system even if its equity curve is composed out of paper trades. After all, remember the first article of this series. Bad performance is, in effect, most probably just a synonym for ‘currently out of synch’.
So the result would be like an array of non-correlated (*) very simple systems, together making for a robust aggregate system watched by an EQA playing the role of a money manager allocating money to the best performing (in synch) systems while closely watching the others (out of synch) by measuring their paper trade performance. As soon as the latter start to improve, these systems will regain access to real money to resume live trading.
There’s a bit of an analogy here with computer hardware where we started using a bunch of independent and inexpensive disks to build one disk far more robust than any single disk one could buy. This is called a RAID (redundant array of inexpensive/independent disks). This far outweighs the costs building evermore reliable single disk hardware. This application does the same, building a robust system out of lots of independent and easy to understand (inexpensive) systems. We could introduce the acronym ASITS (array or Aggregate of Simple Independent Trade Systems). No need any more to back test, fine tune curve fit rules and looking for a one-size fits all system holy grail.
The biggest win in such an aggregate EQA idea is that all of the trade systems in the pool can be kept very simple. Simple being a harbinger for robustness. After all, simplicity is the ultimate sophistication.
As a closer we should keep monitoring the correlation between the systems in our ASITS as that might change over time also. There’s no need for, even some danger in, having correlated systems in an aggregate.
(°) Average True Range, the average daily range, taking gaps into account. A measure for the volatility of a time series.
(*) independent and inexpensive to build and test.
Where to start
Many traders and trade systems builders probably will have too many ideas on what rules and systems to combine. But a few places to start looking for non-correlation could be combining long and short systems. Short term systems with long term systems. Retracement and swing systems with momentum systems and breakout strategies. Even value systems with growth systems. It might be even as simple as combining systems making the same decisions (perhaps built on moving averages) in different time frames. That way the true winners on longer term time frames will start to shine when markets are trending. In non-trending or more volatile markets, the shorter term systems probably will kick butt.
Just start experimenting and don’t forget sharing ideas, feedback and results with me on your ASITS. There’s still a lot of ground to cover on this idea I developed in our company (www.chartmill.com).
Next time …
… is question time. We’ll take on some hard questions and criticism regarding the ideas in this article series, that eventually led up to the idea of an ASITS. Any questions would be very welcome by the end of April 2012. Just send them to this author at dirk@monest.net.
[FIGURE 1]

[HEAD] Equity Curve Control feedback loop
[CAPTION] Figure 1: The equity curve at the output of a system is analyzed. Based on this equity curve analysis, the system trades live or on paper (to be able to continue measuring a theoretically paper equity curve). The theoretically ‘paper’ equity curve is shown in gray, the real equity curve is blue. As soon as the system starts ‘working’ again, live trading is resumed.
[FIGURE 2]
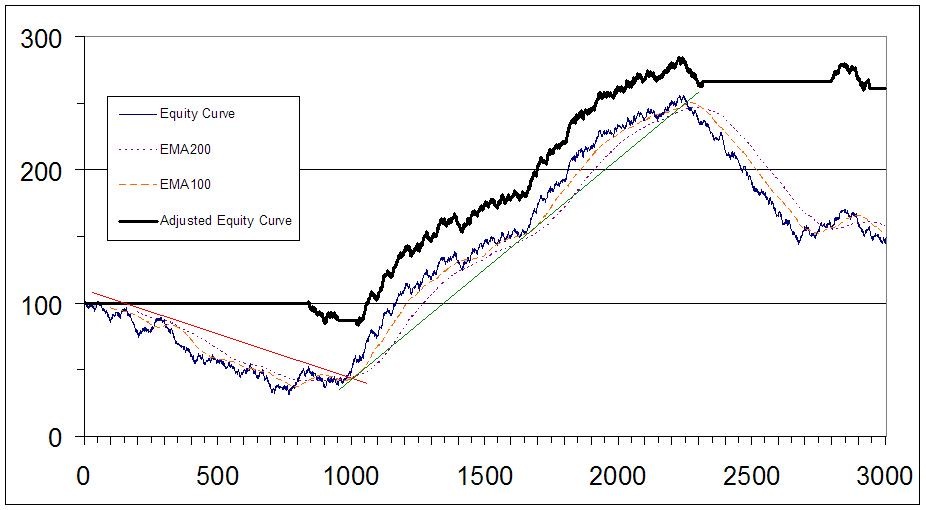
[HEAD] Actual equity curve Analysis and control of a real trading system.
[CAPTION] Figure 2: Equity curve of a trend following trading system through changing market environments. Both trend lines and moving averages are shown on the chart. Moving averages being slightly better candidates for algorithmic implementation (software). The charts also shows the new equity curve not only being rescued from a draw down but also starting out avoiding one from the beginning. This implies that the control loop was started in paper trading mode (the most conservative approach through the eyes of a feed forward test).
DIRK VANDYCKE is actively and independently studying the markets for over 15 year, with a focus on technical analysis, market dynamics and behavioral finance. He writes articles on a regular basis and develops software partly available at his website www.chartmill.com. Holding master degrees in both Electronics Engineering and Computer Science, he teaches software development and statistics at a Belgian University. He’s also an avid reader of anything he can get his hands on. He can be reached at dirk@monest.net.