
2 Day RSI Trading Strategy
The RSI 2 trading strategy as discussed in this post is based on the RSI indicator and is designed to quickly identify overbought and oversold conditions in the market. In this article we will go into the intricacies of a specific RSI 2 swing trading strategy. The strategy is specifically aimed at active traders who hold positions for several days to at most several weeks.
This specific strategy is part of the category of mean reversion' strategies. This is a collective term for trading systems that look for extreme price movements on the assumption that strongly diverging prices will always return to their mean levels. Further explanation can be found in the basic article "What Is a Mean Reversion Strategy? Understanding the Basics of Mean Reversion in Trading"
The 2 day RSI Trading Strategy Rules
1. Identify The Price Extreme (Bullish of Bearish)
The first step is to identify a price extreme. The easiest way to do this is to compare the price to a simple moving average such as the SMA20. This SMA represents the average price over the past 20 trading days. The greater the distance of the current price from that SMA20 the more significant the price extreme is.
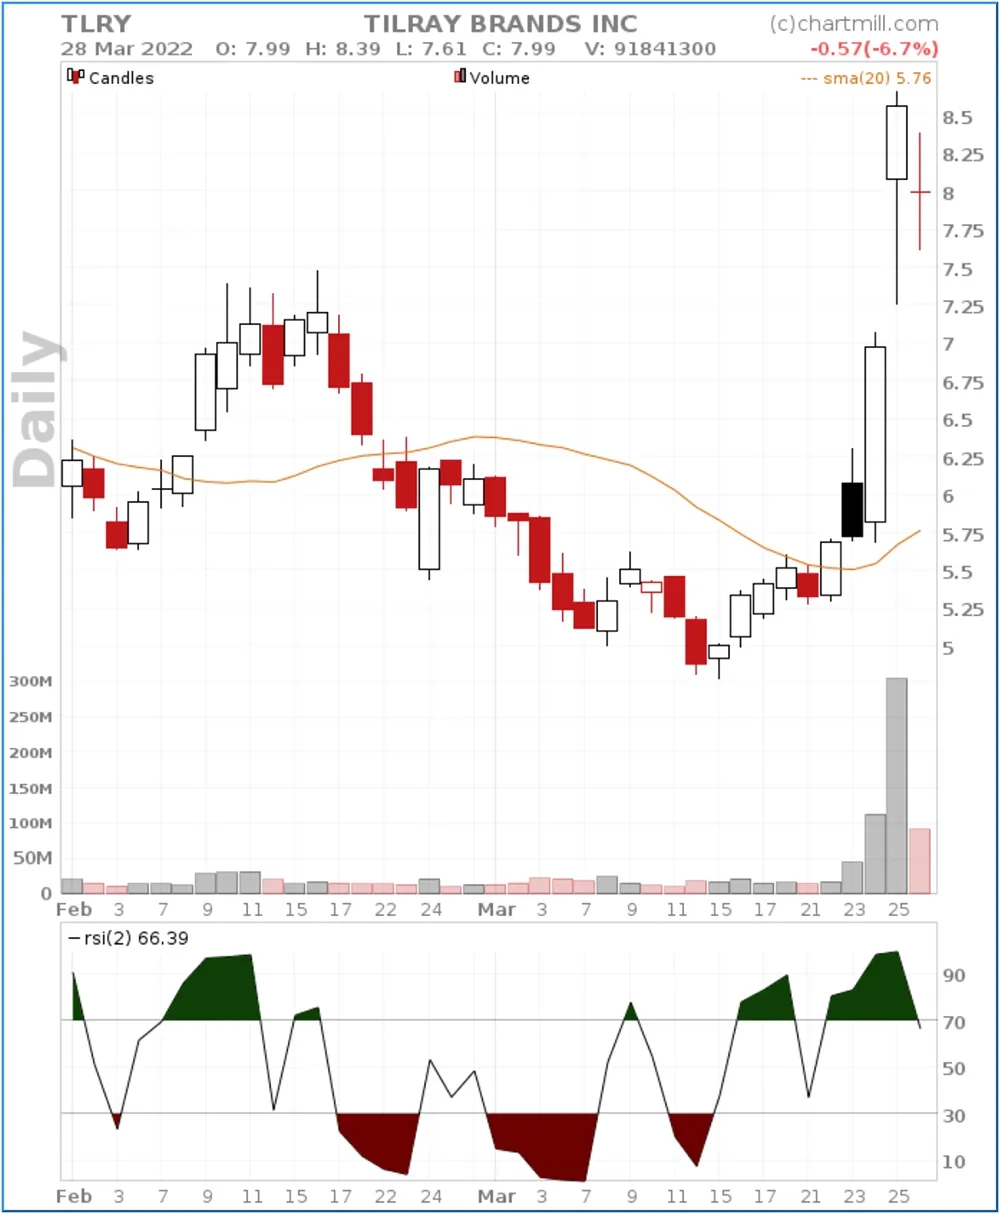
The chart below of Tilray Brands Inc (NASDAQ:TLRY) stock shows such a price extreme.
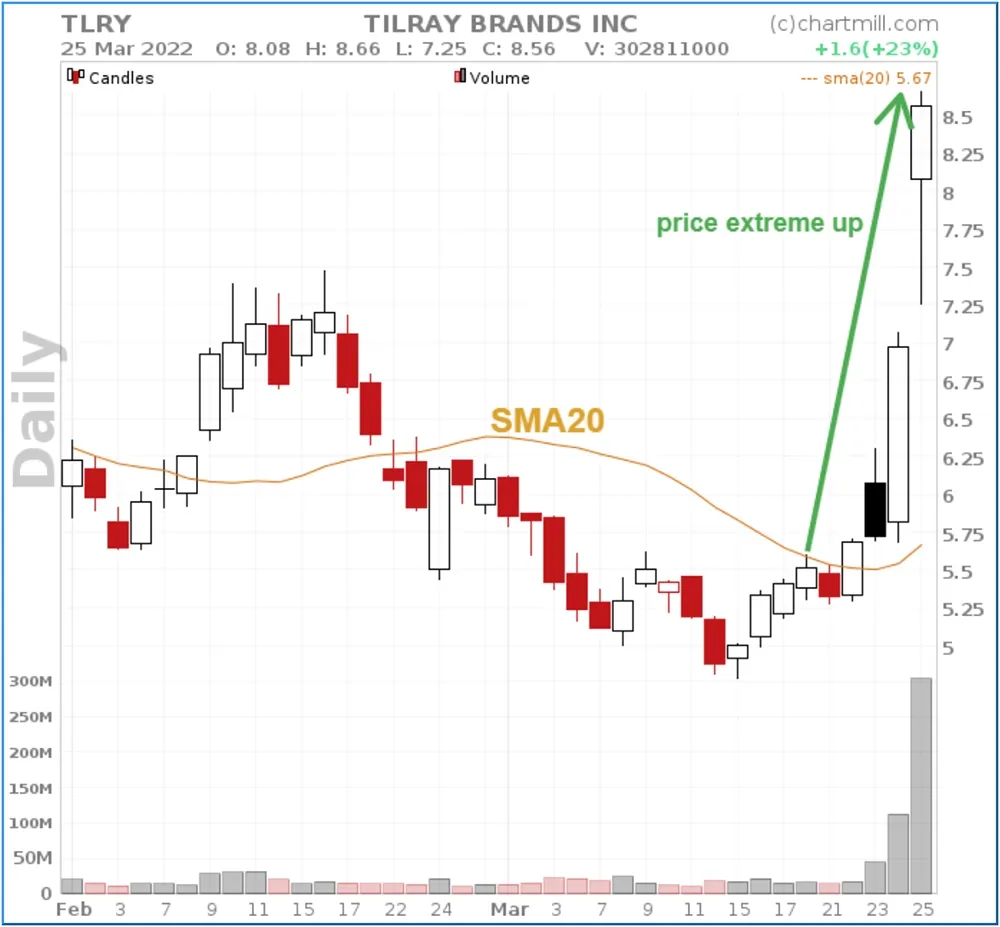
The Tilray Brands stock with an SMA20 illustrated on it.
A sudden very sharp rise in price from March 23 with a peak price on March 27 indicates the upward price extreme (green arrow) where the price deviates far from the 20-day price average.
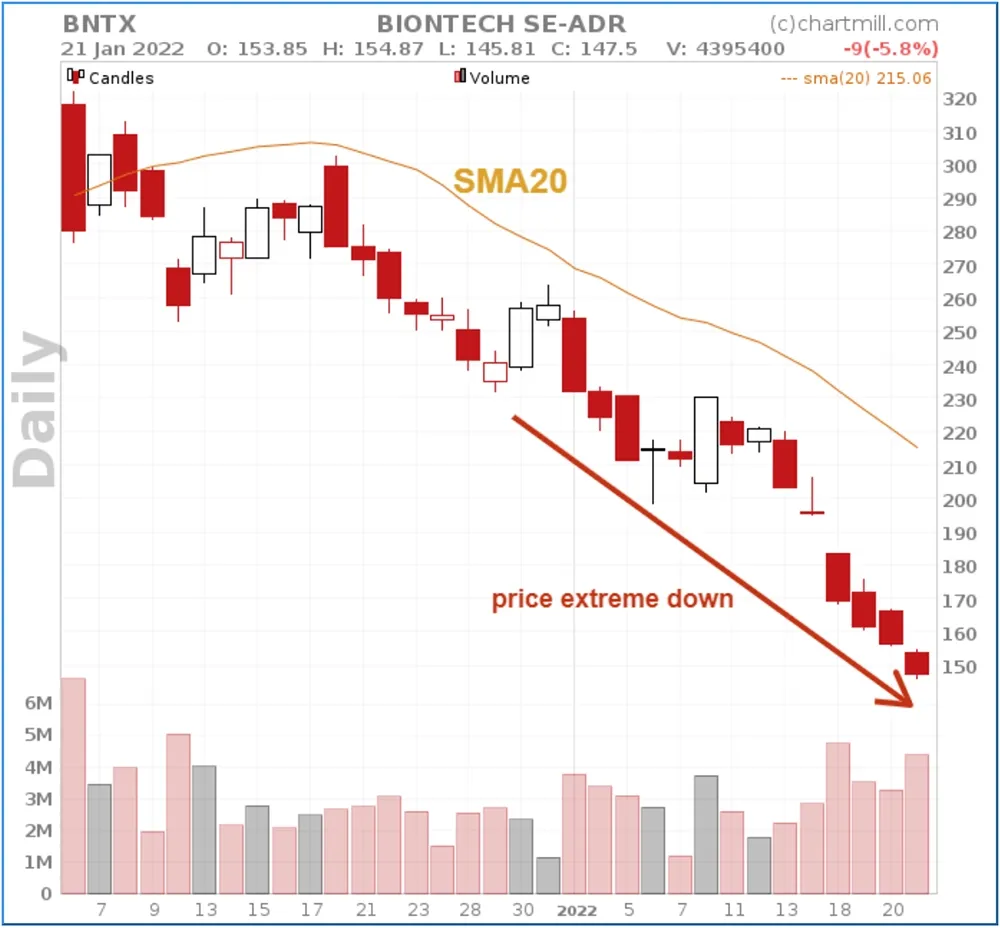
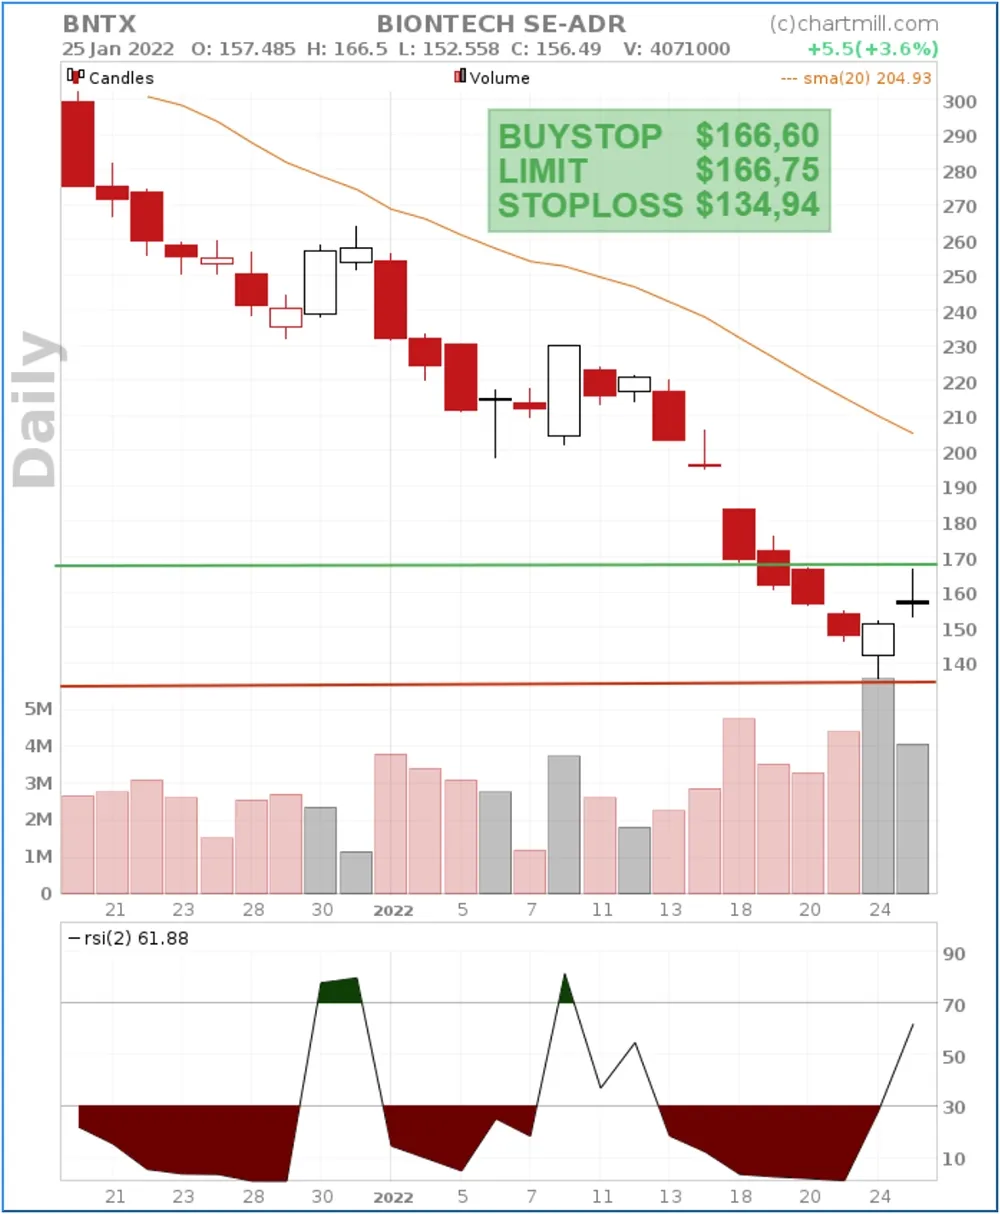
A similar price extreme but on the bearish side is seen in the stock of Biontech (NASDAQ:BNTX). A sharply declining price, leading to a downward price extreme where the price has deviated significantly from the SMA20.
The great advantage of a stock screener is that with a few smart price filters you can easily create a screen that looks for such price extremes fully automatically. Finding good setups is therefore not only much faster but also much more objective...
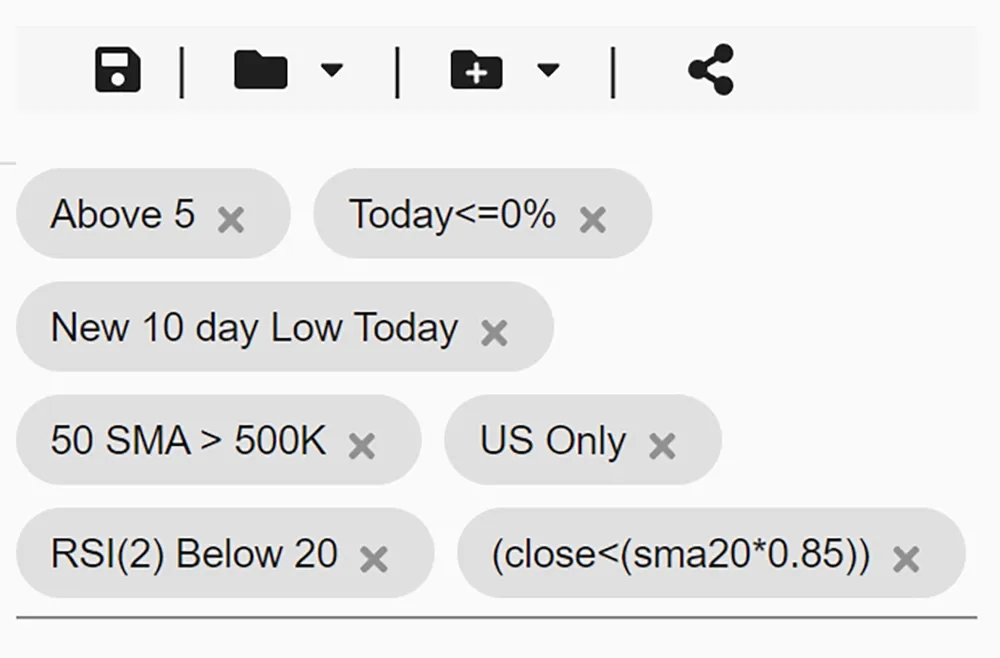
This screen for example shows all stocks that are at their lowest point in the last 10 days and are at least 15% lower than the SMA20. The RSI(2) filter ensures that we only keep stocks whose RSI(2) value is lower than 20.
This basic selection can then be used to further manually screen for the most interesting candidates.
2. RSI (2-period) Below 10 Or Above 90
Using the RSI(2), we try to identify the moment at which the recovery movement (regression to the mean) will possibly occur. We do so by looking for the moment on the chart when the RSI(2) indicates a value below 10 (bullish) or above 90 (bearish).
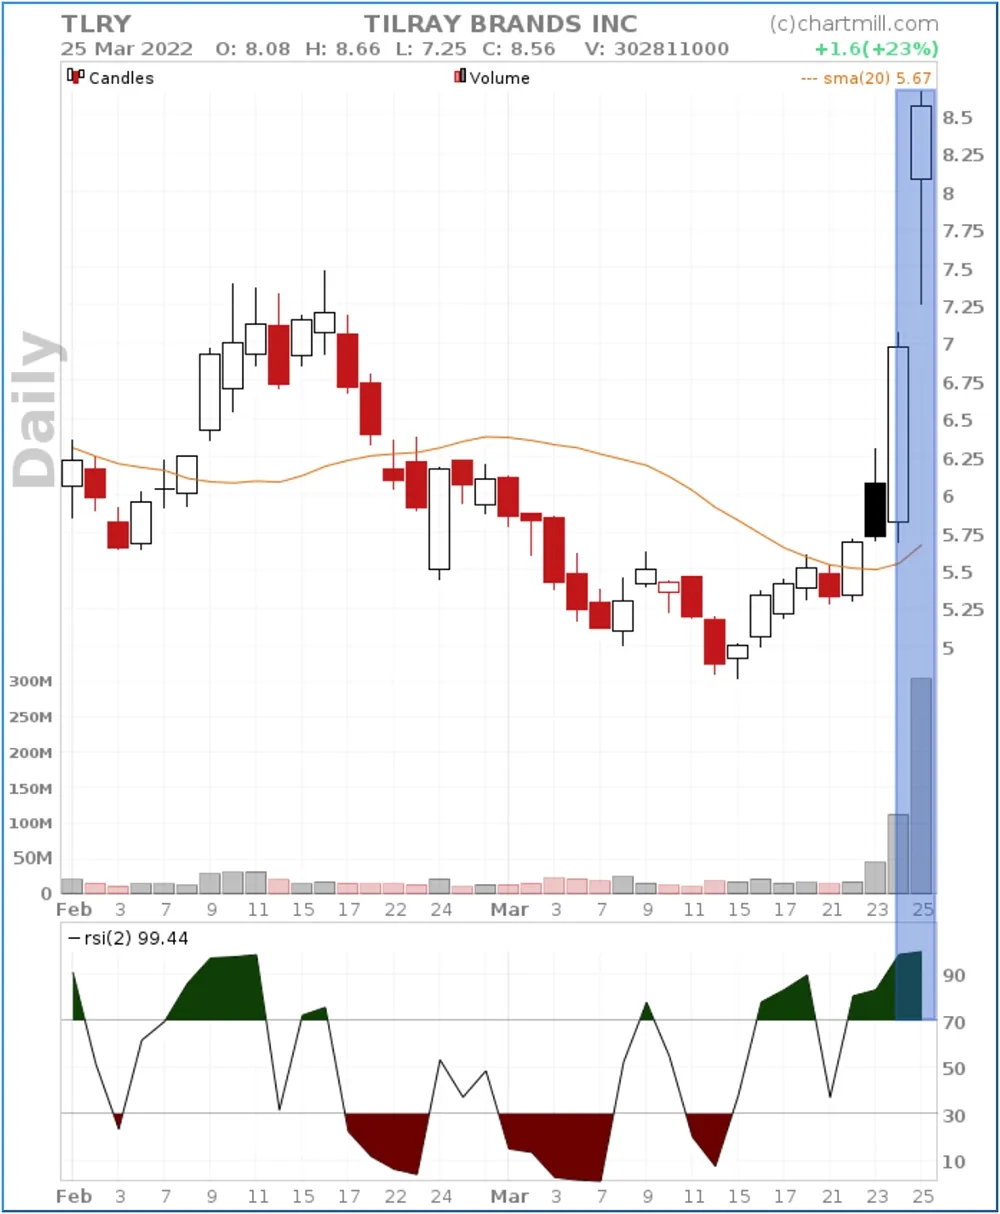
In the TLRY chart we have added the RSI(2) indicator. You can see that its value exceeds 90 from 2022-02-24 indicating an extremely overbought situation.
Also, on date of 2022-02-25, the RSI is still quoting above the 90 level.
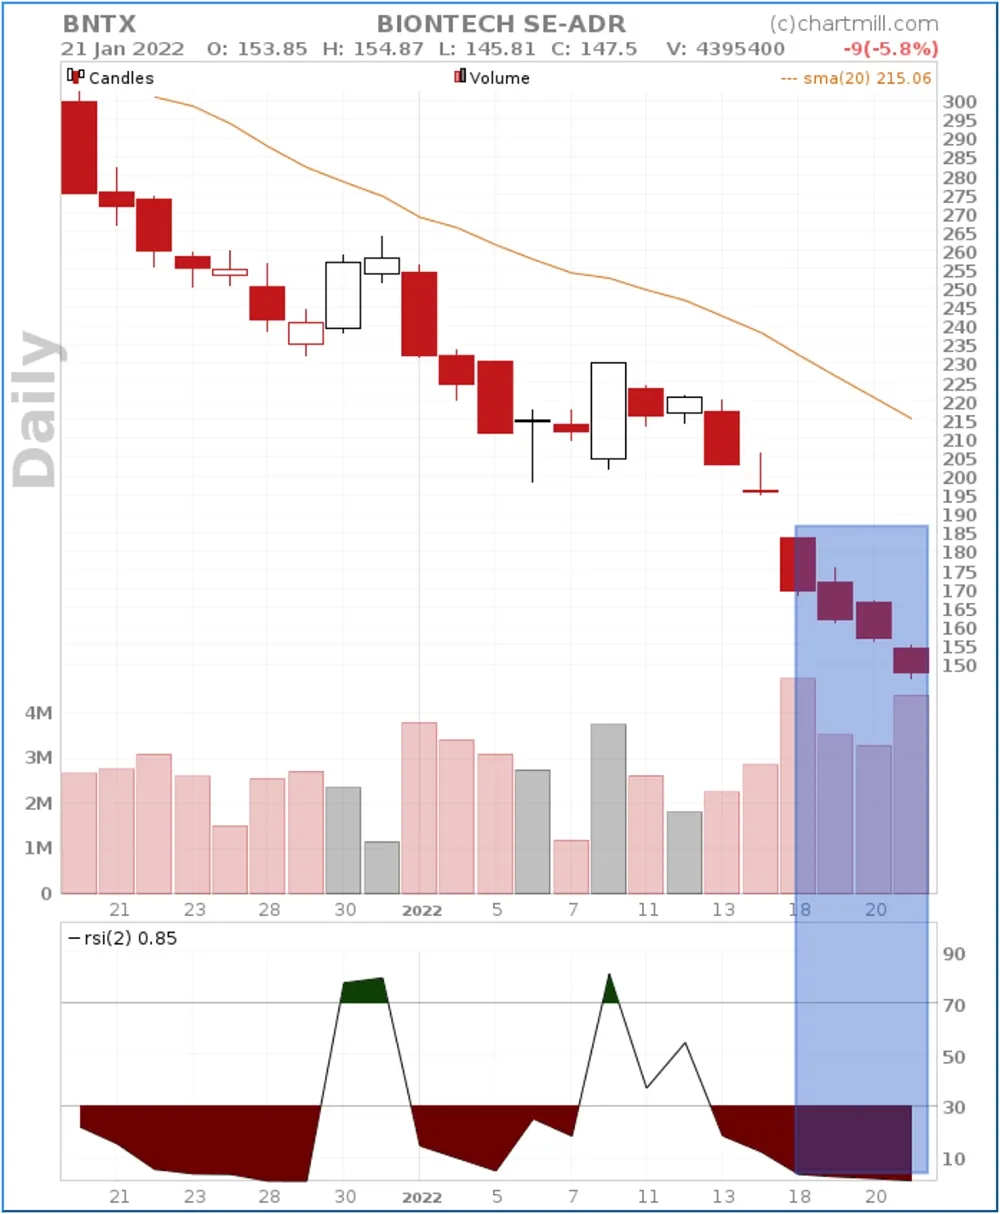
As for BNTX, we observe an RSI(2) below 10 from January 18, 2022 through January 21.
An upward or downward price extreme accompanied by an RSI(2) value quoting above 90 or below 10 are the two necessary conditions before this strategy can be applied.
3.- RSI (2-period) Rises Above 10 (Bullish Setup) Or Falls Below 90 Again (Bearish Setup)
This is the final step before we can configure the actual setup to enter the market. An RSI(2) with a value of +90 falling again below the 70 level is the indicator signal to go short.
In the chart of TLRY, the RSI(2) is recording just below 70 after the trading day of 2022-03-28.
An RSI(2) with a value below 10 which rises again above the 30 level is the indicator signal to go long.
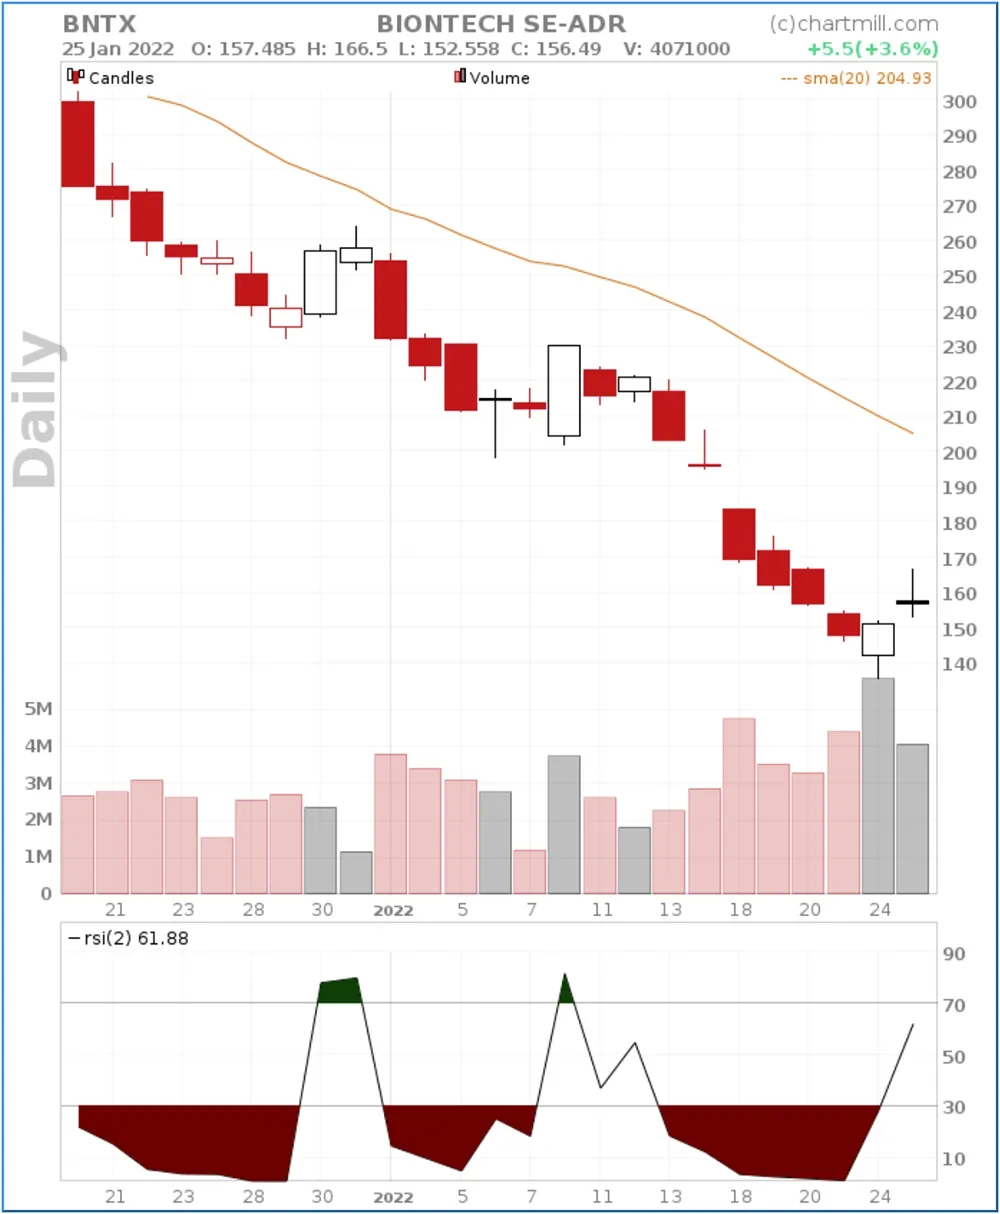
This can be observerd in the chart of BNTX on the date of 2022-01-25.
This setup to buy or sell is only possible if these first 3 steps are completed.
4. Opening A Position
Only when the 3 first steps are fulfilled, a position can be opened.
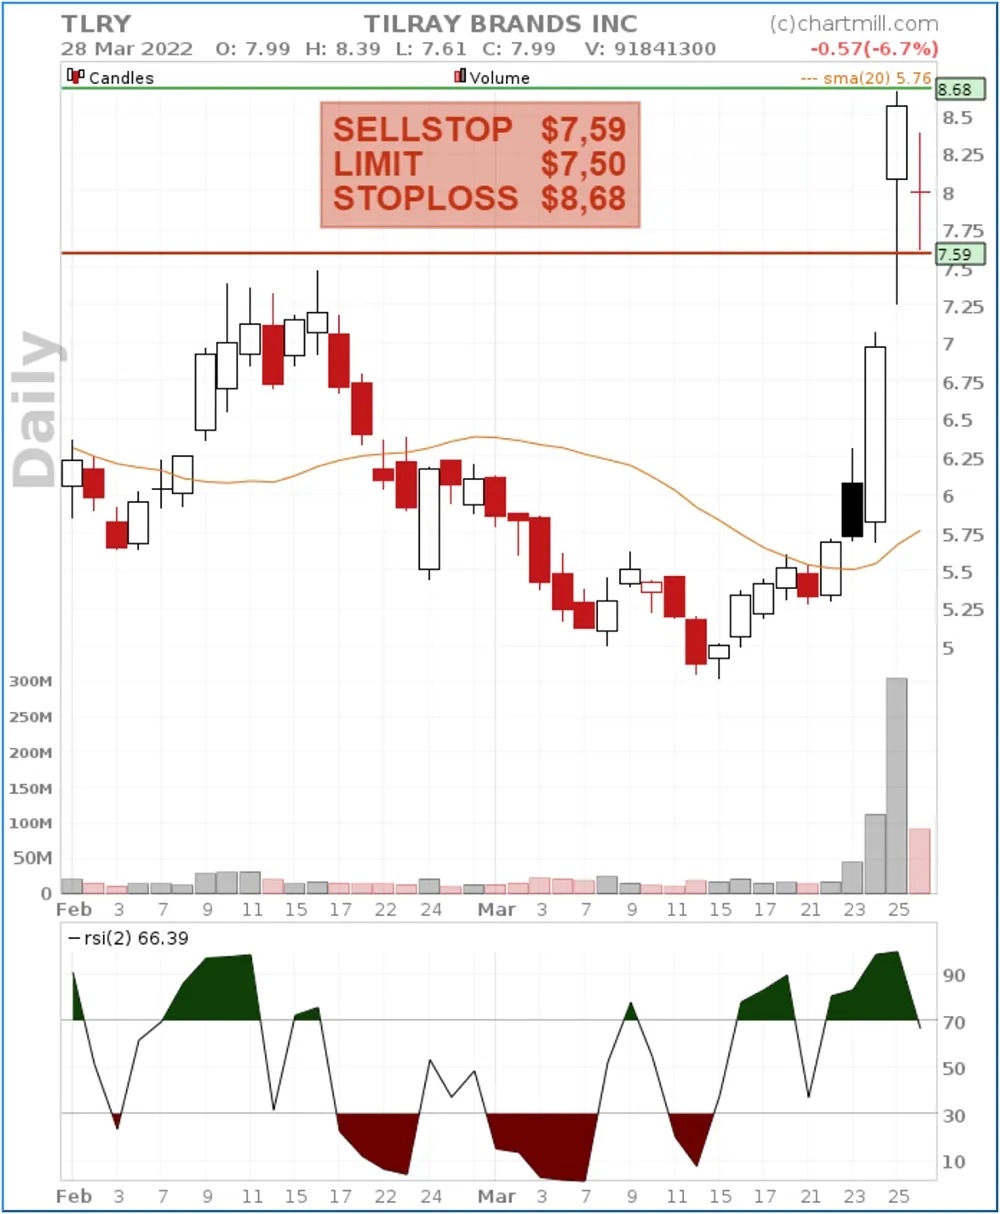
The use of a buy/sell stop limit order allows to determine the entry very precisely. With a 'Sell Stop Limit Order' we define that the price of the stock must first continue to fall below the low of the signal candle before the short order becomes active (in the case of TLRY).
In the case of BNTX a 'Buy Stop Limit order' is used where the price first has to rise above the high of the last candle before the order becomes active and can be executed.
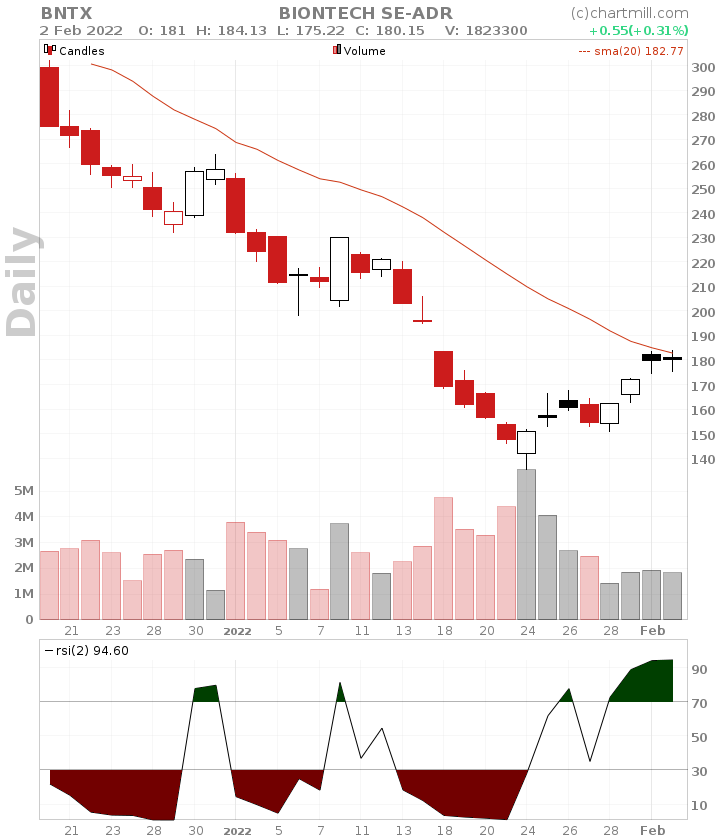
For BNTX the order is triggered the very next trading day and barely 6 days later the price hits the SMA20 which is the first target.
Depending on how you manage the position further the profit at this level can be cashed in partially or completely. For the remaining part the stoploss can be adjusted upwards.
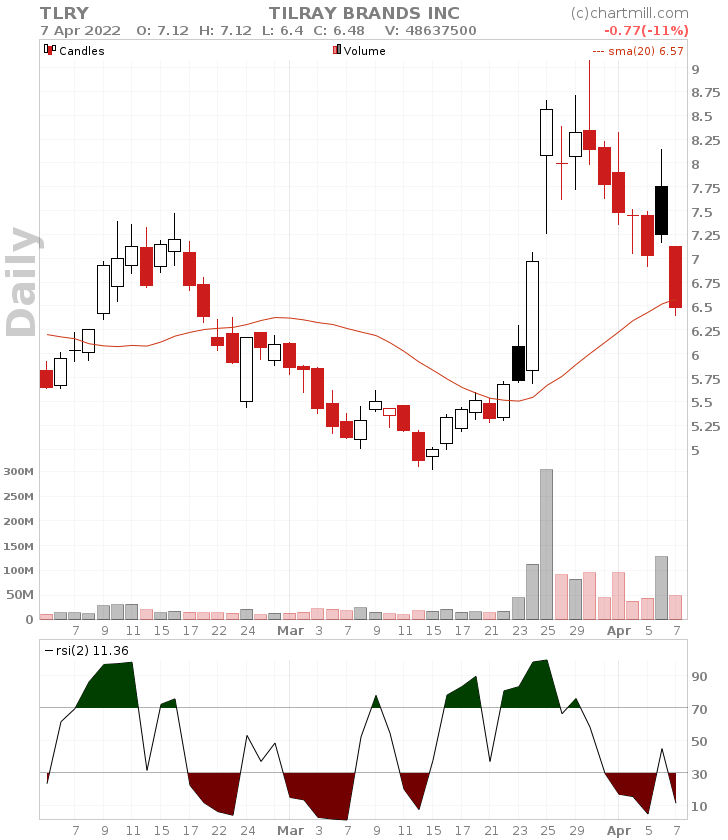
As for TLRY, the price initially went a bit higher and the sell order was not triggered initially. The RSI(2) indicator thus again entered oversold territory at 2022-03-29.
The following day, a bearish doji candle was formed and the RSI(2) falls below the 70-level for the second time.
A modified short entry just below the low of this doji candle with a stoploss above the high was definitely a setup to consider in the context of this mean reversion strategy.
The position was never compromised in the process and the SMA20 was touched on date of 2022-04-07.
Other Similar 2-period RSI Trading Examples
Long WB
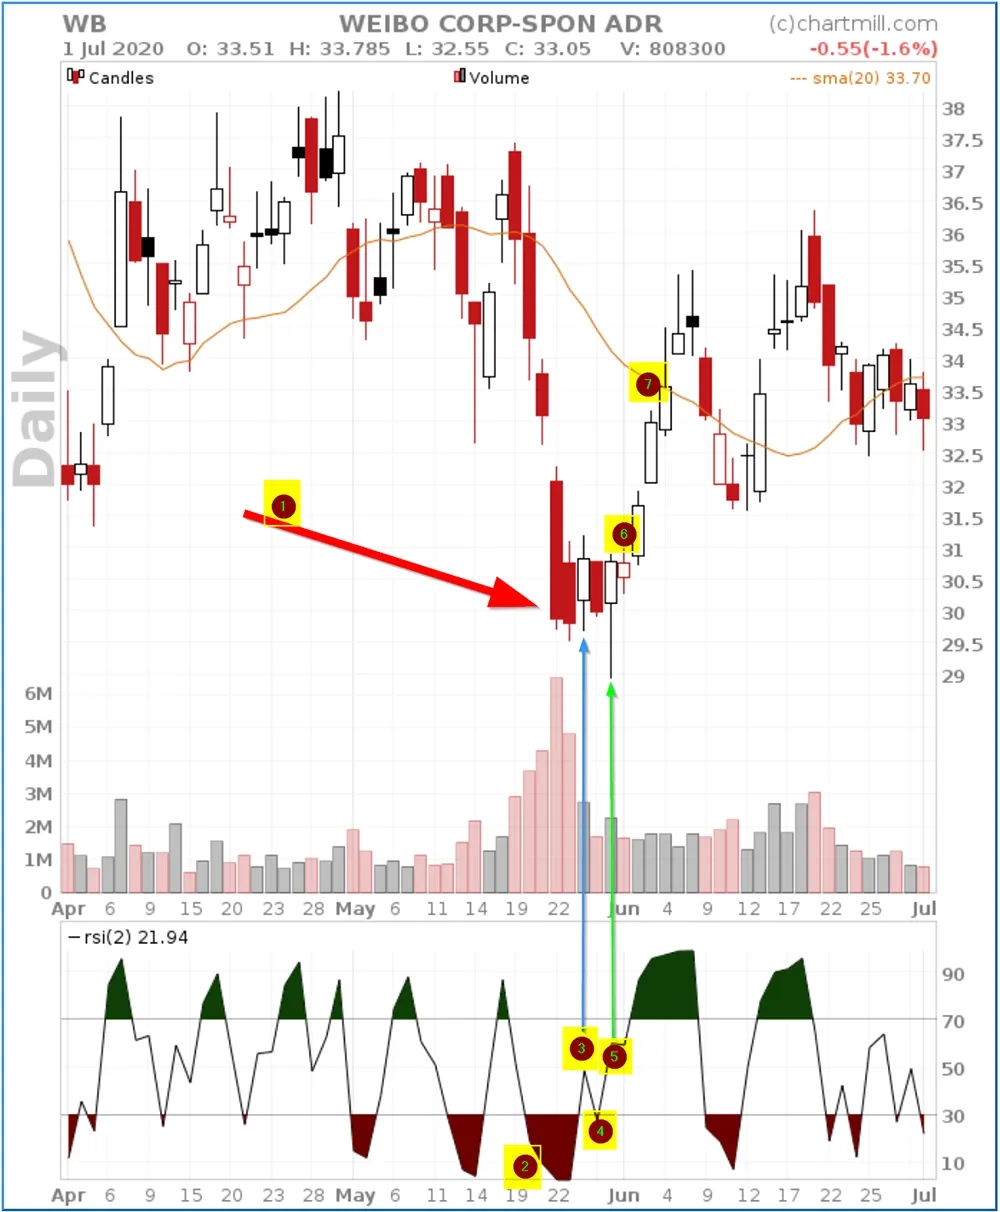
- price extreme down, price deviates significantly from the SMA20
- RSI(2) indicator < 10
- RSI(2) indicator > 30 (however, there is no entry the next day because the high of the candle indicated by the blue vertical arrow is not taken out)
- RSI(2) drops below the 30-level again
- RSI(2) > 30 and
- This time the high of the candle indicated by the green arrow is taken out on the following trading day (long entry with a stoploss below the low of the downward price range).
- 1st target reached (SMA20)
Long IAS
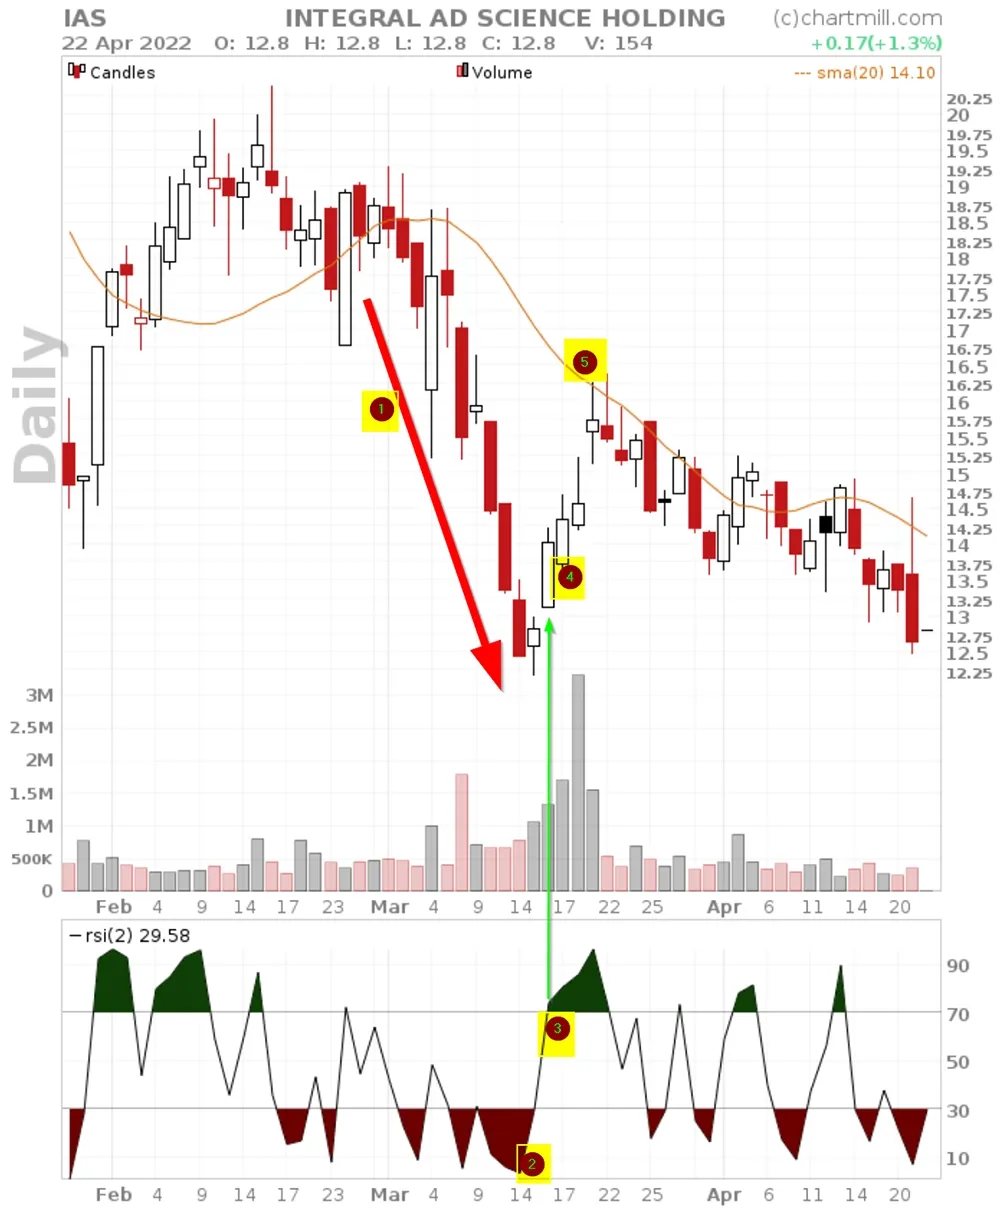
- price extreme down, price deviates significantly from the SMA20
- RSI(2) indicator < 10
- RSI(2) indicator > 30
- High of the candle indicated by the green arrow is taken out (long entry with a stoploss below the low of the downward price range).
- 1st target reached (SMA20)
Short EIGR
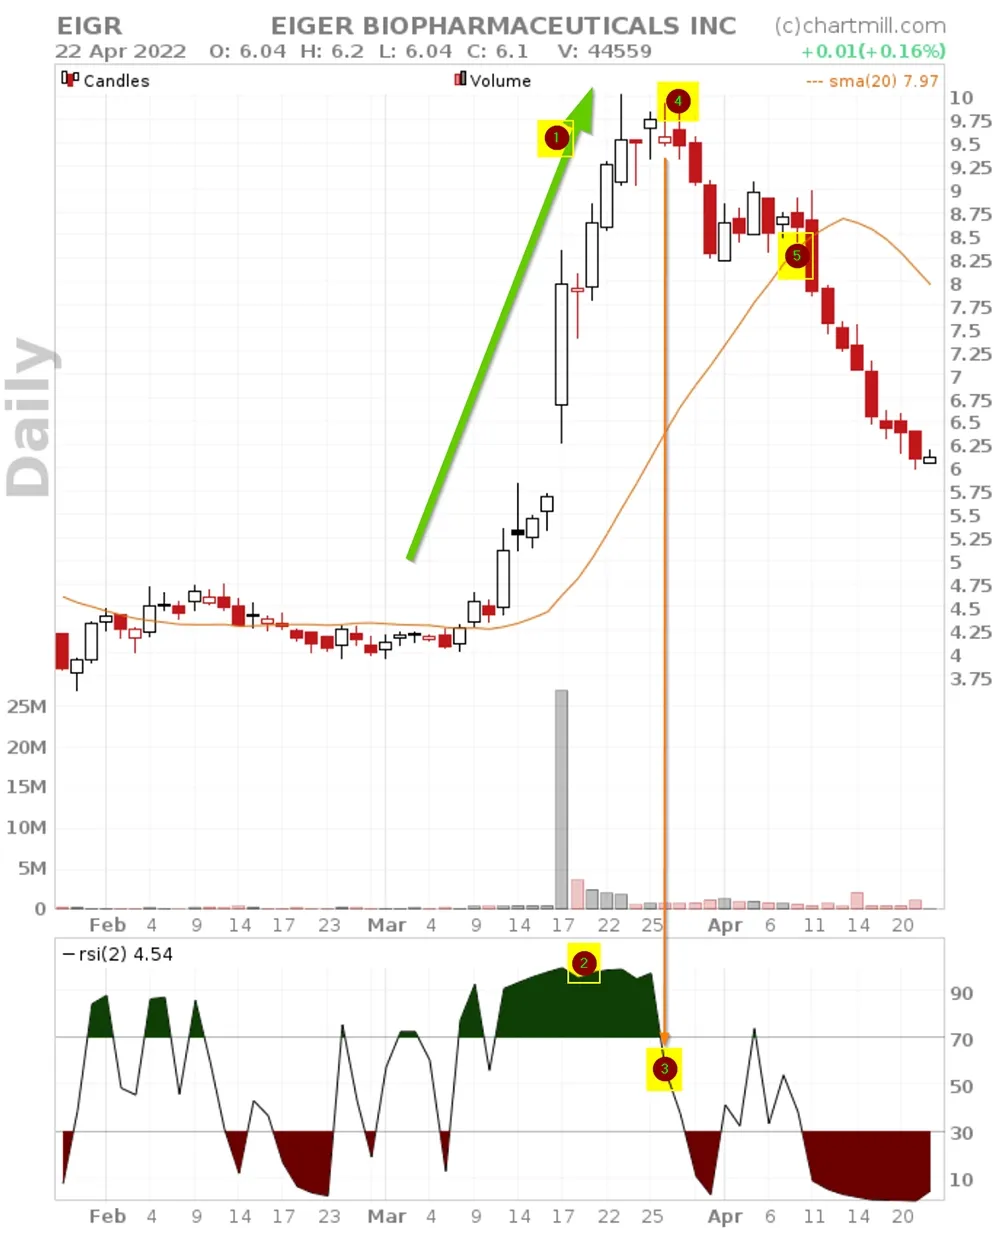
- price extreme upside, price deviates significantly from the SMA20
- RSI(2) indicator > 90
- RSI(2) indicator < 70
- Low of the candle indicated by the orange arrow is taken out (short entry with a stoploss above the high of the upward price range).
- 1st target reached (SMA20)
Some Important Considerations When Using This Strategy
-
Make sure that the price extreme is clearly visible, the greater the strength and speed with which the price has deviated from the average line, the greater the chance that a corrective movement will follow, pushing the price back in the direction of the average price.
-
Respect your stoploss at all times! A powerful move can sometimes last much longer than expected. Especially for moves that have an underlying fundamental reason such as company results that are far above expectations, for example, things can go very fast in a very short time.
-
Do not try to anticipate the countermove, wait patiently until the RSI(2) recovers from the overbought or oversold status and always use the stop limit orders which are set slightly higher or lower than the high or low of the trigger candle. By doing so you will be able to avoid a lot of false signals.
-
Don't simply base your strategy on one indicator but try to find other additional elements that support your view and setup. A recovery move from an important support level on a higher timeframe for example or the shape of the signal candle itself (bullish hammer or a bullish engulfing pattern...). The more converging elements the stronger the setup!
Related Topics
The RSI Indicator: What Is It And How To Use It?
The RSI is an oscillator which is used to determine oversold and overbought conditions. In this article we will focus on the practical usage. Read more...
What Is a Mean Reversion Strategy? Understanding the Basics of Mean Reversion in Trading
This strategy assumes that extreme price movements, whether upward or downward, are temporary and that prices will eventually revert to their average levels. Read more...
How To Use RSI For Swing Trading? A Checklist
In this article, we go over the different steps needed to successfully use this indicator in a swing trading strategy. Read more...