
How To Use RSI For Swing Trading? A Checklist
The Relative Strength Index indicator is one of the many technical indicators used by technical analysts to profit from short to medium-term price fluctuations in the market.
More detailed information about this indicator can be found in our basic article: 'The RSI Indicator: What Is It And How To Use It?'
In this post, we go over the different steps needed to successfully use this indicator in a swing trading strategy.
1. Select the appropriate time frame
Typical swing trading strategies hold positions for several days to weeks. Positions are thus also held overnight.
The default setting in swing trading is 14 periods on the daily timeframe. This corresponds to a period of 14 days.
Shorter periods will generate more signals but in doing so the margin of error will also increase. When using longer periods you may have missed some of the movement.
2. Determine the prevailing trend
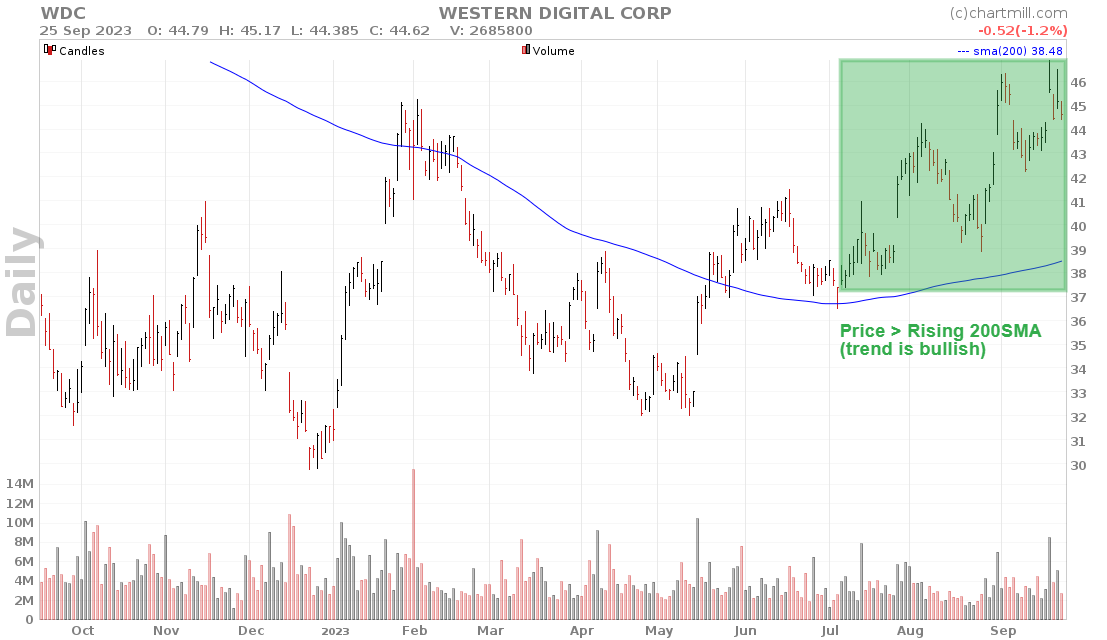
Trading in the direction of the dominant trend offers the greatest chance of success. You can determine that long-term trend, for example, using the 200-day moving average line. For long positions, choose only stocks whose long-term average is rising and where the price of the stock is above it.
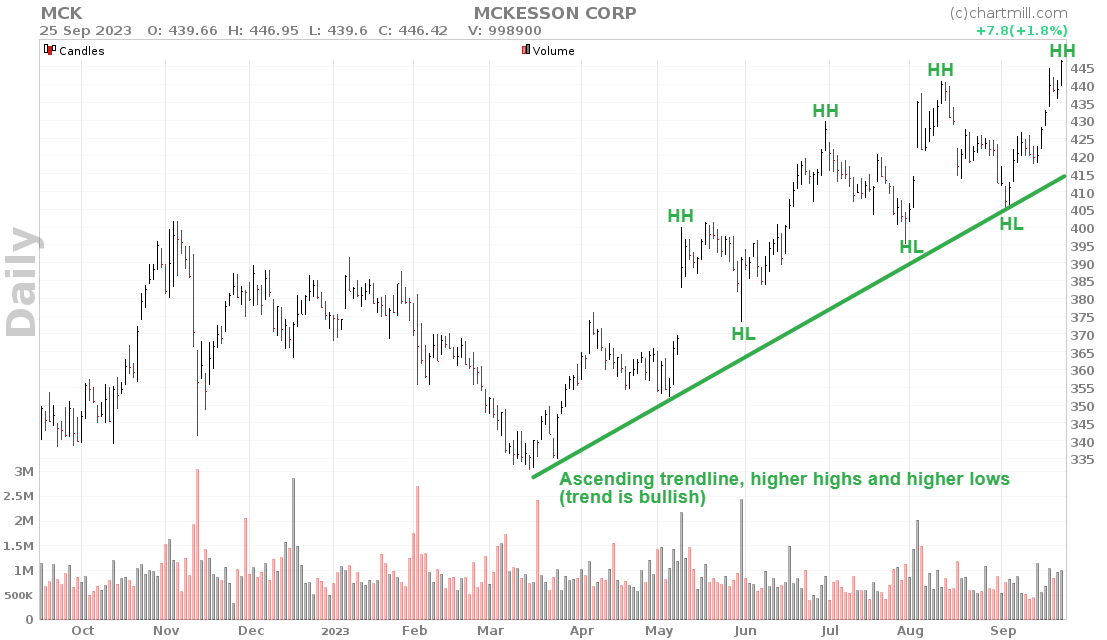
Using ascending trend lines (at least three connecting points) is another - purely visual - way to determine the prevailing trend.
3. Define (and refine) the RSI signals
Typically, levels 70 and 30 are used to identify overbought and oversold assets, respectively, where a potential trend change is in the making.
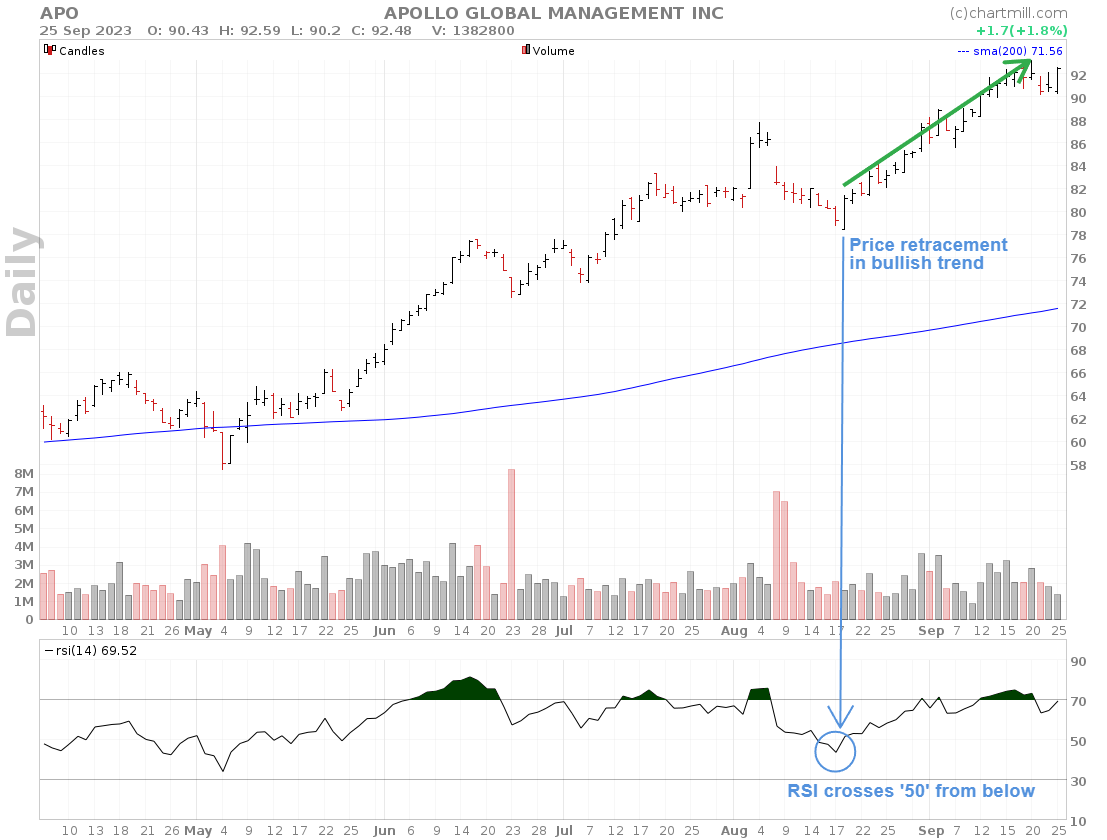
Don't pin yourself down on such levels, however; much depends on the momentum and strength of the existing trend. In a strong rising market, for example, a temporary price reversal will not always result in an RSI falling below the 30 level.
The same goes for strong descending markets where a temporary price rebound does not automatically mean that the RSI will also rise above the 70 level.
In the above cases, an RSI value recovering from the 50-level can already trigger a valid buy or sell signal.
4. Don't rely solely on the indicator
Technical analysis and its indicators offer absolutely no guarantee of success. Trading purely based on this or any other indicator is the fastest way to lose capital!
Above we have already mentioned to trade only in the direction of the prevailing long-term trend. After all, that will ensure that you avoid a lot of false signals.
Also, always keep in mind the price action. Chart and candlestick patterns and/or support and resistance levels occurring simultaneously with the indicator signal are important confirmation signals that will significantly increase the reliability of your trade setups. Remember that it is not the quantity of signals that matters, but their quality.
5. RSI-divergences
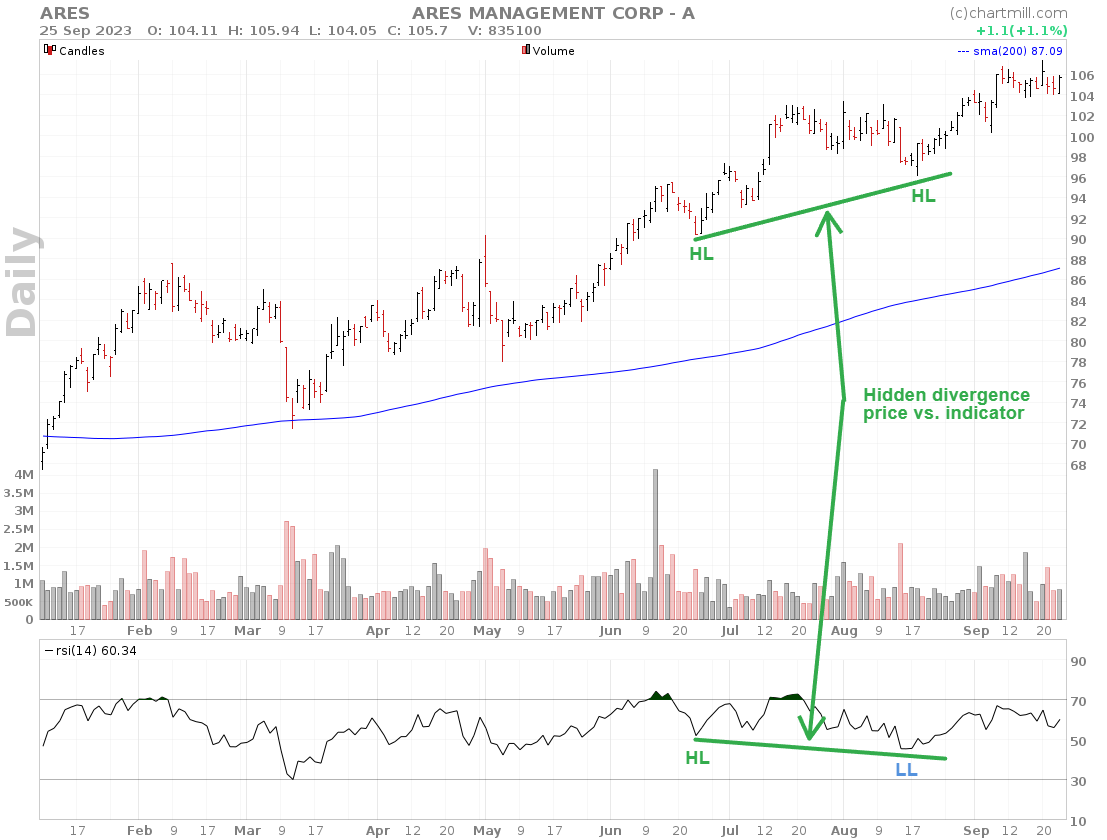
You could already read what types of divergences there are and what they mean in our basic article. When looking for entry points in a strong trend, it is mainly the hidden divergences that are important.
This is a derivative of the classic divergence and occurs mainly in stocks that show a clear upward or downward trend.
The hidden divergence becomes visible the moment the price temporarily falls in a rising trend or temporarily recovers in a falling trend.
6. Determine precisely your entry and stop-loss
Plan the trade and trade the plan!
Based on your strategy, define your entry point and stop-loss in advance. This ensures that you can perfectly pinpoint and limit your risk. After all, protecting your risk capital is your number one priority.
The exit can also be a predetermined fixed price level but another option is to use a trailing stop-loss to profit from the trend for as long as possible and protecting a larger portion of the accumulated profits as the price moves further in your favor.
You can find more detailed info about a trailing stop loss in our article 'Trailing Stop Loss: Safeguarding Your Investments While Maximizing Winners!'
In this video '2 Simple and Effective Exit Strategies to Boost your Profits in Trading', we show you how to maximize your profits by using two different types of trailing stop losses.
7. Position sizing and risk management
At least as important as the trade setup itself is the way you determine the size of your position and the risk associated with it (in relation to your set stop-loss).
Only those who can manage their loss positions well and ensure that losses remain effectively small will be able to become and remain successful in the long run. Taking five consecutive losses of 1% on your entire investment capital is not a disaster. However, a few open positions that individually cause several tens of percent losses on your portfolio are!
A useful tool to calculate exactly how much you can buy is the ChartMill Position Sizing Tool available on our platform. Learn more via this link.
You can read more useful information about the importance of position size and risk in this article 'On What We Invest and What We Risk', which is part of a six-part article series on risk. Highly recommended!
Be Sure To Read These Articles As Well
The RSI Indicator: What Is It And How To Use It?
The Relative Strength Index Indicator is probably one of the most popular technical indicators used by traders worldwide. It is a momentum indicator that captures (the speed of) price changes. Read more...
2 Day RSI Trading Strategy
The RSI 2 trading strategy as discussed in this post is based on the RSI indicator and is designed to quickly identify overbought and oversold conditions in the market. The strategy is specifically aimed at active traders who hold positions for several days to at most several weeks. Read more...