Overbought or Oversold: Chartmill Value Indicator and Dynamic RSI
Several classical technical analysis indicators attempt to indicate overbought or oversold levels in instrument prices. The best know examples are the RSI or Relative Strength Index, developed by Welles Wilder and the Stochastics Oscillator, developed by George C. Lane.
A well known problem of these indicators is that prices can remain into overbought or oversold territory for several weeks on a daily chart, so they are not really able to predict a reversal.
We will present two indicators here that attempt to overcome these shortcomings in the classical indicators: The Dynamic RSI and the Chartmill Value indicator.
Dynamic RSI
The RSI value line on the Dynamic RSI indicator is exactly the same as the RSI value on the regular RSI indicator. The only difference is that overbought and oversold levels are not fixed, but dynamic. These levels are determined by Bollinger bands around the RSI value line. This results in more reliable signals and the indicator typically never remains into overbought/oversold territory for more than a day. We will demonstrate this in an example below.
Chartmill Value Indicator
The chartmill Value indicator was built to overcome some of the problems observed in classical indicators. Its strength is that it quickly adapts to new realities in price formation and attempts to signal extremes in price formation. Like the Dynamic RSI, signals typically last only a single day. For practical usage, all you need to know if that reading below -8 indicate oversold and readings above +8 indicate overbought situations.
It is always good to have an in depth understanding on the indicators you are using. The Chartmill Value Indicator was described in depth in Traders Magazine and Stocks And Commodities. The articles from Traders Magazine are published on our website and can be found here.
Notes:
- At the time of writing the indicator was called the 'Monest Value Indicator'.
- The article also contains backtest results showing the effectiveness of the indicator.
Practical Example.
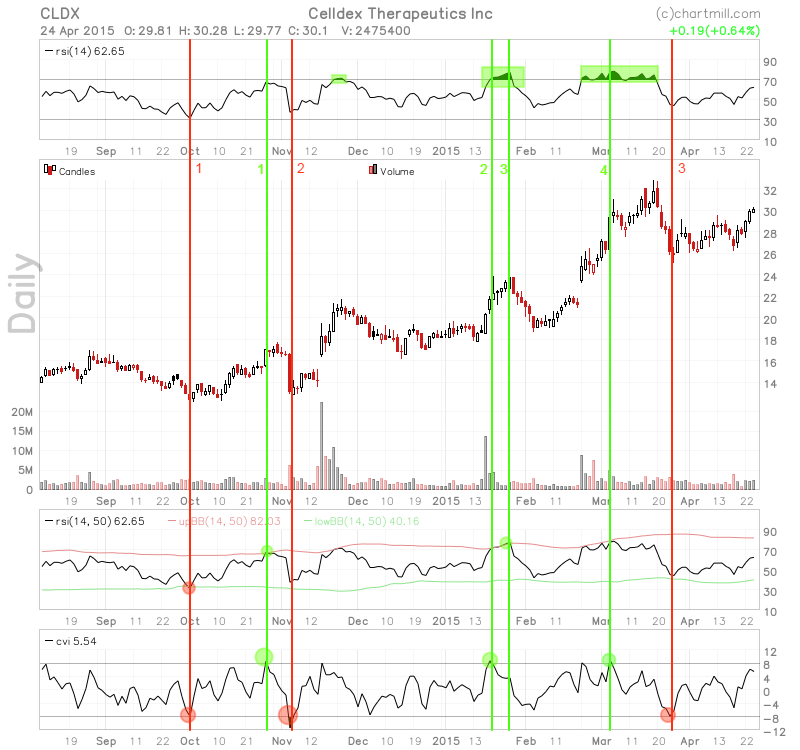
On the chart above, we displayed both the Dynamic RSI and the Chartmill Value indicator. For reference, we also displayed the classical RSI above the price chart. These are our observations:
- The first thing to note is that the classic RSI never signaled an oversold situation. It did however signal a couple of overbought zones, which demonstrates the point we made at the start of the article (long lasting 'zones' rather than signals). However, we also see that we get very good signals when the RSI drops out of overbought territory.
- The Chartmill Value indicator signaled 3 oversold situations, all of which were followed by an immediate reversal. The Dynamic RSI signaled the first oversold signal at the exact same time.
- The first overbought signal was signaled by both the CVI as the DRSI. Although a few days were needed, a reversal followed.
- The second overbought signal was signaled first by the CVI (too soon) and a few days later by the Dynamic RSI (spot on).
- The last of the overbought signals was just signaled by the CVI and almost by the DRSI. A minimal and very temporary reversal followed.
Stock Screening with the indicators.
All of the indicators mentioned in this article (RSI, Stochastics, Dynamic RSI and Chartmill Value) are available in our stock screener.
This is an article with more mean reversion screening ideas which also shows how to use these indicators in the screener can be found.