
Wall Street Rebounds as Powell Calms Market Nerves
U.S. stock markets rebounded strongly on Friday after a turbulent trading day, as Federal Reserve Chairman Jerome Powell reassured investors with a calm and measured speech.
Market Volatility and Economic Concerns
Earlier in the day, major indexes were in the red, with losses of 1-2%, driven by concerns over the economy. The latest jobs report showed that the U.S. added only 151,000 jobs in February, falling short of the expected 160,000.
Additionally, the unemployment rate unexpectedly rose to 4.1%, fueling investor anxiety.
Powell’s Words Steady the Market
Powell addressed these concerns in a speech in New York, acknowledging economic uncertainty but emphasizing that the U.S. economy remains in good shape. He stated that there is no need to rush policy adjustments, which helped ease market fears.
Following his remarks, Wall Street shifted from losses to gains. However, Powell will not be making further public comments until the Federal Reserve’s next interest rate decision on March 19.
Stock Market Highlights
Broadcom (AVGO | +8.7%): The AI chipmaker exceeded revenue expectations for the current quarter, boosting investor confidence in AI-related stocks.
Walgreens (WBA | +7.4%): The pharmacy chain surged after private equity firm Sycamore Partners announced plans to take it private at a 29% premium.
Hewlett Packard Enterprise (HPE | -12%): Shares plunged after the company announced job cuts affecting 2,500 employees, citing the negative impact of tariffs. Lower-than-expected earnings guidance further pressured the stock.
Costco (COST | -6%): The retailer missed Wall Street's profit expectations due to rising procurement costs, leading to a decline in its stock price.
Conclusion
Despite a rough week for stocks, Powell’s comments helped stabilize the market, turning losses into gains. However, with no further statements from Powell in the coming weeks, investors may face continued uncertainty leading up to the next Federal Reserve decision.
Daily Market Analysis – March 07, 2025 (After Market Close)
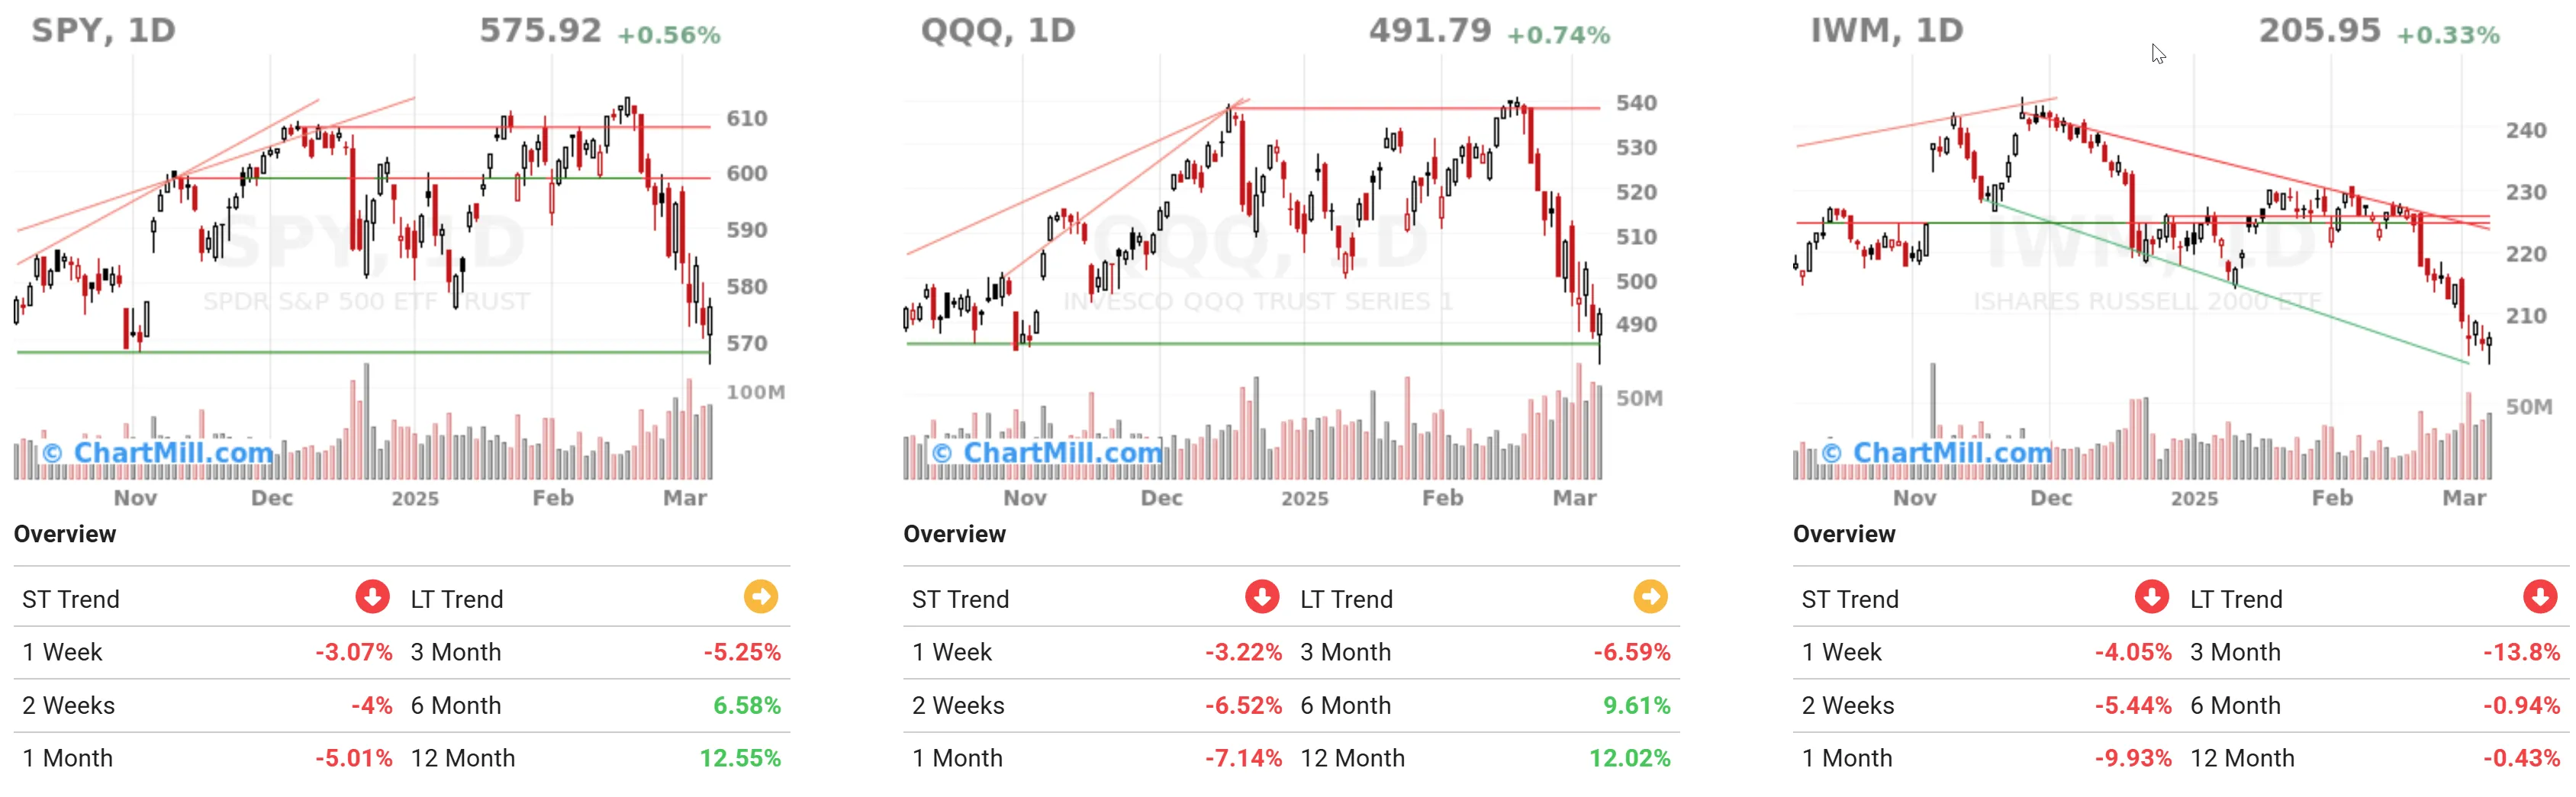
SPY (S&P 500 ETF)
Short-term trend is down, showing a -3.07% drop over the last week.
The medium-term trend (1 month) has a slight recovery of +2.55%, but the overall longer-term trend is still neutral (+12.55% in 12 months).
Crucial Price Levels:
- The price is trading near key horizontal support around $575. A break below this level could signal further downside potential.
- The current position of the price above this support suggests the potential for a rebound if this level holds, especially with bullish momentum on the long-term horizon.
QQQ (Nasdaq 100 ETF)
Short-term trend shows a more significant drop of -3.22% in the last week.
The medium-term trend is bearish (-6.59% over the last 3 months), while the long-term trend is neutral (+12.02% in 12months).
Crucial Price Levels:
- The price of QQQ is near critical support at around $480. If this level fails to hold, further declines towards $450 could be expected.
- The downward movement below this level could indicate more substantial losses in the short-term.
IWM (Russell 2000 ETF)
Short-term trend shows a smaller drop of -0.45% in the last week, but the medium-term trend is more concerning with a drop of -5.44% in the past 2 weeks.
The long-term trend is showing a more significant decline of -13.8% over 3 months, which signals weakness in the small-cap segment of the market.
Crucial Price Levels:
- The price is near significant support at $205, and failure to hold above this level could signal further declines.
- With a bearish medium-term trend, a break below the key level at $200 could confirm a continued downtrend.
Sector Analysis
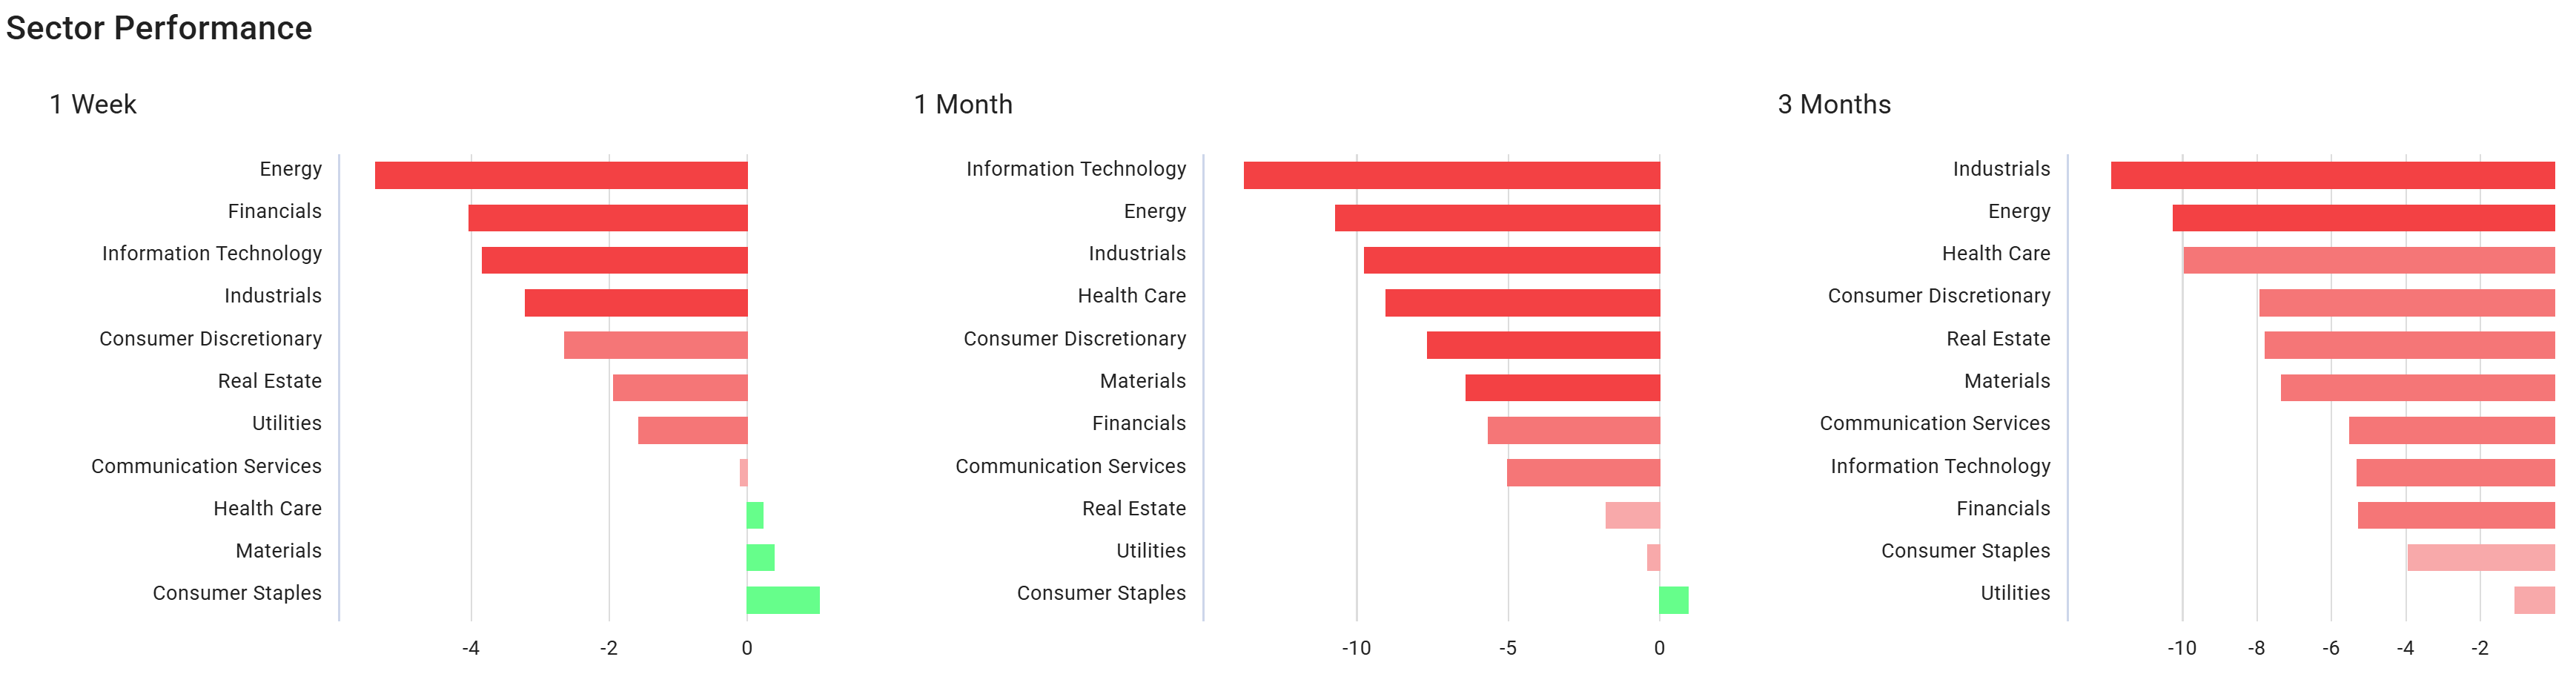
On a weekly basis, we see a shift in sector performance.
While last week 'Financials' and 'Real Estate' were the leading sectors, both have fallen back this week. In fact, Financials show the second-largest decline on a weekly basis.
The current top 3 on a weekly basis are 'Consumer Staples (+1.04%) ', 'Materials (+0.38%)', and 'Health Care (0.22%)'.
The energy sector saw the biggest decline this week, with a loss of more than 5%. It is also the sector that consistently ranks among the top 2 weakest-performing sectors on the weekly, monthly, and three-month timeframes.
Market Breadth Analysis

Observations and Comparisons:
-
Advancing Days: On March 7, the percentage of advancing days was relatively low at 59.4% but increased from earlier in the week. This suggests a slight recovery in the broader market sentiment.
-
Declining Days: The percentage of declining days was high earlier in the week (76% on March 3), but it has improved, showing a shift towards a more balanced market.
-
The number of stocks quoting above some key moving averages (SMA 20, 50, 200) is still very low, a confirmation of the prevailing negative market sentiment.
Direct link to our Market Monitor Page
General Conclusion
The SPY just ends the week above its 200-day average. The QQQ is closing just below it.
For IWM, it is already the third week in a row that the close is lower than the SMA 200. The “Small Cap Index ETf” is down nearly 15% from its November 25, 2024 high.
The sector performance indicates slight recovery in Consumer Staples, Materials & Healthcare on a weekly base. Energy stays very weak.
Market breadth analysis indicates some recent yet very fledgling improvement in market sentiment. Caution is warranted as the majority of stocks are still well below some key moving averages.
In summary, despite some minor positive signals in the short term, the broader market still faces substantial risks, particularly in small-cap stocks.
Monitoring key support levels and market breadth will be essential in the coming weeks.