
Energy giant EXXON MOBIL CORP (NYSE:XOM) has been identified by a technical screening process made to find promising breakout chances in the stock market. The screening approach uses two specific indicators from ChartMill: the Technical Rating, which judges a stock's overall technical condition, and the Setup Quality Rating, which measures the quality of its present consolidation pattern. Stocks that get high marks on both metrics, typically 7 or above, are seen as leading choices for technical breakouts, as they show fundamentally solid trends that are taking a pause before possible continuation moves.
Technical Strength Assessment
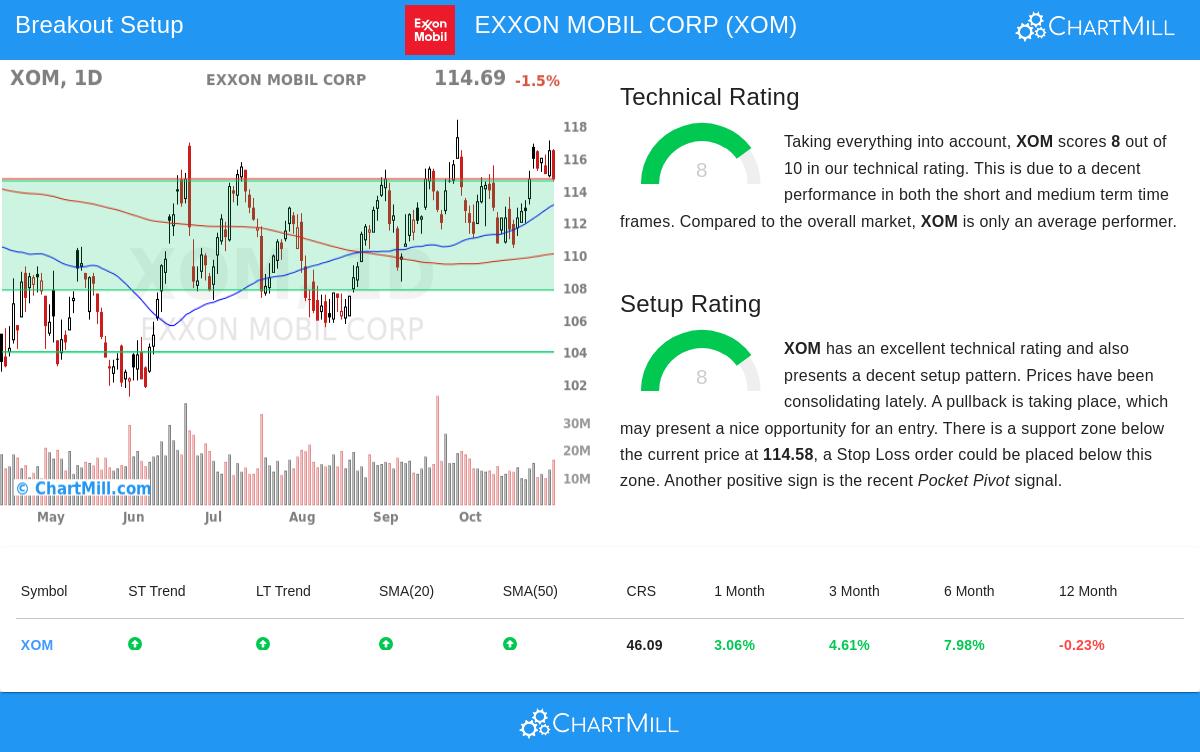
Exxon Mobil shows solid technical features, receiving a Technical Rating of 8 out of 10 in its detailed technical report. This score shows strong momentum over various timeframes and puts the stock in the higher group of technically healthy equities. A few elements add to this positive assessment:
- Both short-term and long-term trends are clearly positive, showing sustained buying pressure
- The stock is trading above all main moving averages (20, 50, 100, and 200-day SMAs), with each average moving upward
- Recent performance shows steady gains over several periods: +3.06% (1-month), +4.61% (3-month), and +7.98% (6-month)
The Technical Rating's value is in its capacity to find stocks with confirmed upward momentum, which is important for breakout plans since they depend on the continuation of existing trends rather than trying to catch falling stocks or find bottoms in declining issues.
Setup Quality Evaluation
Besides strong technicals, Exxon Mobil shows an appealing setup pattern with a Setup Rating of 8. This shows the stock has been consolidating in a specific range, forming a possible base for the next upward move. The consolidation stage is especially important because it lets the stock reduce overbought conditions and build energy for its next important price change.
Important setup features include:
- Prices have been trading between $110.39 and $117.05 over the last month, showing managed volatility
- A recent Pocket Pivot signal points to accumulation, where price increased on higher volume than any down volume day in the prior ten sessions
- Several support areas exist below current prices, with the closest major support ranging from $107.80 to $114.58
- The stock is presently trading near the top of its recent range, indicating a chance for an upside breakout
The setup quality measure helps technical investors time their entries more efficiently by finding stocks that have finished needed consolidation periods and could be getting ready for their next important price movement.
Trading Considerations
For traders watching Exxon Mobil for possible breakout chances, a few technical levels need focus. The stock meets immediate resistance between $114.70 and $119.04, a zone created by several trendlines over different timeframes. A clear move above this resistance could indicate the start of a new upward phase.
Support levels are clearly set, with the most important support zone extending from $107.80 to $114.58. This multi-layered support, formed by a mix of trendlines and moving averages, gives a logical area for placing protective stop-loss orders if the expected breakout does not happen. The stock's average daily volume of about 14.4 million shares provides sufficient liquidity for position entry and exit.
While Exxon Mobil displays encouraging technical features, it is important to note that the stock has performed worse than the wider market lately, with the S&P 500 trading near new highs while XOM stays in the middle of its 52-week range. This relative underperformance could offer a catch-up chance if the technical breakout takes place.
Finding Additional Opportunities
The technical breakout screening method that found Exxon Mobil can be used to discover similar chances across the market. For investors looking for more possible breakout candidates, the Technical Breakout Setups screen regularly updates with stocks displaying both strong technical ratings and good-quality setup patterns.
Disclaimer: This analysis is based on technical indicators and historical price patterns and should not be considered investment advice. Always conduct your own research, consider your risk tolerance, and consult with a financial advisor before making any investment decisions. Technical analysis does not guarantee future performance and should be used as one tool among many in the investment decision-making process.