
Our technical analysis method uses two exclusive metrics to find good breakout chances in the stock market. The ChartMill Technical Rating measures a stock's general technical condition, and the Setup Quality Rating looks at consolidation patterns that usually come before notable price changes. Stocks with good scores on both metrics often offer attractive risk-reward situations for technical traders looking for breakout chances.
Technical Strength Assessment
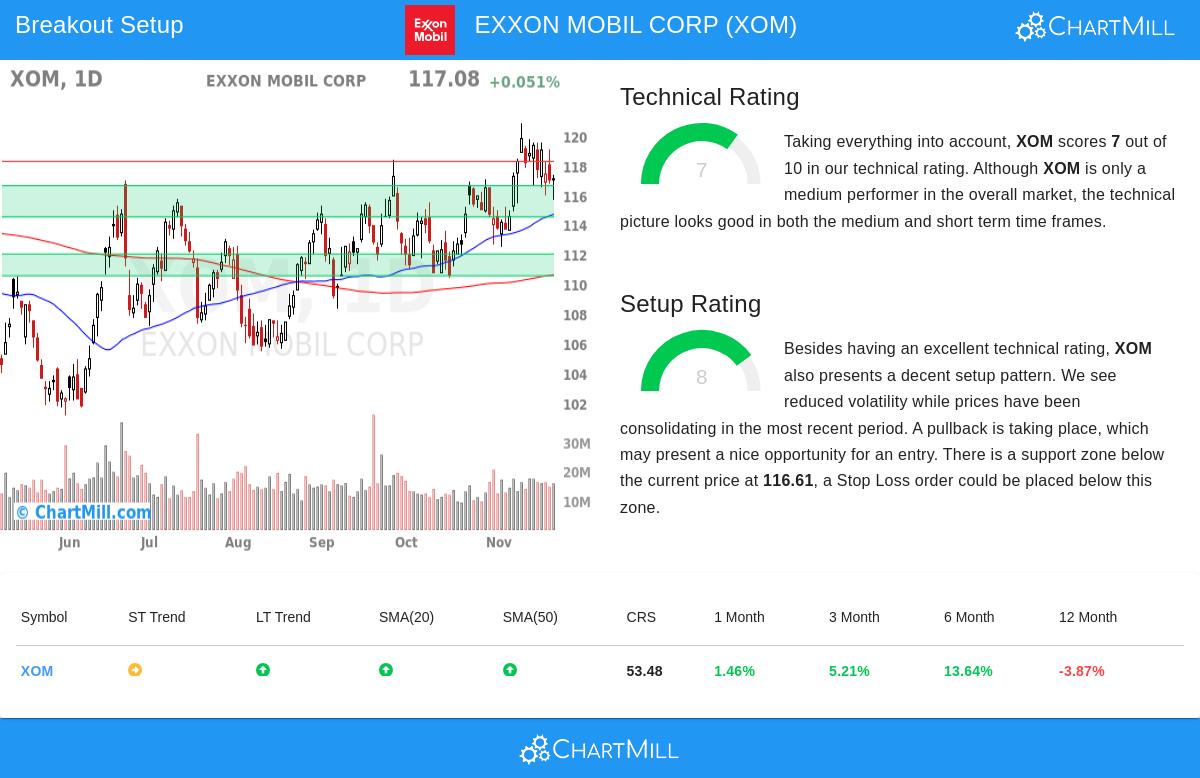
EXXON MOBIL CORP (NYSE:XOM) shows good technical foundations with a Technical Rating of 7 out of 10. This rating shows the stock's location in the higher part of its 52-week trading range and its steady results over different periods. The technical condition is clear in a few main points:
- The long-term trend is still positive while short-term momentum is neutral
- All main moving averages (20, 50, 100, and 200-day) are moving up
- Recent results show increases over several periods:
- 1-month performance: +1.46%
- 3-month performance: +5.21%
- 6-month performance: +13.64%
This technical condition is important for breakout plans because stocks with good underlying trends are more likely to maintain breakouts than those in poorer technical states. The full technical analysis report gives more detail on these technical foundations.
Setup Quality Evaluation
The Setup Rating of 8 out of 10 shows Exxon Mobil is now making a good consolidation pattern. This high setup score means the stock has been trading in a narrow range with lower volatility, making a situation that frequently comes before notable price moves. A few items add to this positive setup view:
- Prices have been consolidating lately with less volatility
- A distinct bull flag pattern has appeared after earlier gains
- Several set support areas give specific risk points:
- Main support between $114.51 and $116.61
- Additional support levels at $110.56-$112.02 and $107.80
- Resistance is in the $118.24 to $121.37 area
For breakout traders, this consolidation period is a chance to take positions before possible upward moves. The set support levels allow for accurate stop-loss setting, while the resistance area gives clear breakout confirmation points.
Trading Considerations
The present technical setup indicates a possible breakout situation with entry near $118.25, just above important moving averages, and stop-loss setting around $115.44. This situation presents a risk of about 2.37% per share, which is within acceptable limits for breakout plans. The stock's average daily volume of 14.8 million shares gives enough liquidity for position entry and exit.
While the technical view looks positive, traders should be aware that the S&P 500 now gives mixed signals with a negative long-term trend but positive short-term momentum. This wider market situation could affect Exxon Mobil's breakout possibility and should be watched along with stock-specific technical changes.
For investors looking for similar technical breakout chances, our Technical Breakout Setups screen often finds stocks matching these requirements, giving a useful tool for technical trading ideas.
Disclaimer: This analysis is for informational purposes only and does not constitute investment advice, recommendation, or solicitation to buy or sell any securities. Trading involves substantial risk of loss and is not suitable for every investor. Always conduct your own research and consider consulting with a qualified financial professional before making investment decisions.