
TAIWAN SEMICONDUCTOR-SP ADR (NYSE:TSM) Excels in CAN SLIM Investment Analysis
By Mill Chart
Last update: Oct 1, 2025
The CAN SLIM investment methodology, created by William O'Neil, uses both fundamental and technical analysis to find high-growth market leaders. This methodical process assesses companies using seven main factors represented by the acronym: Current quarterly earnings growth, Annual earnings increases, New products or services, Supply and demand dynamics, Leadership status, Institutional sponsorship, and Market direction. The approach looks for companies with strong earnings momentum, high relative strength, and institutional interest during positive market periods.
Current Quarterly Performance
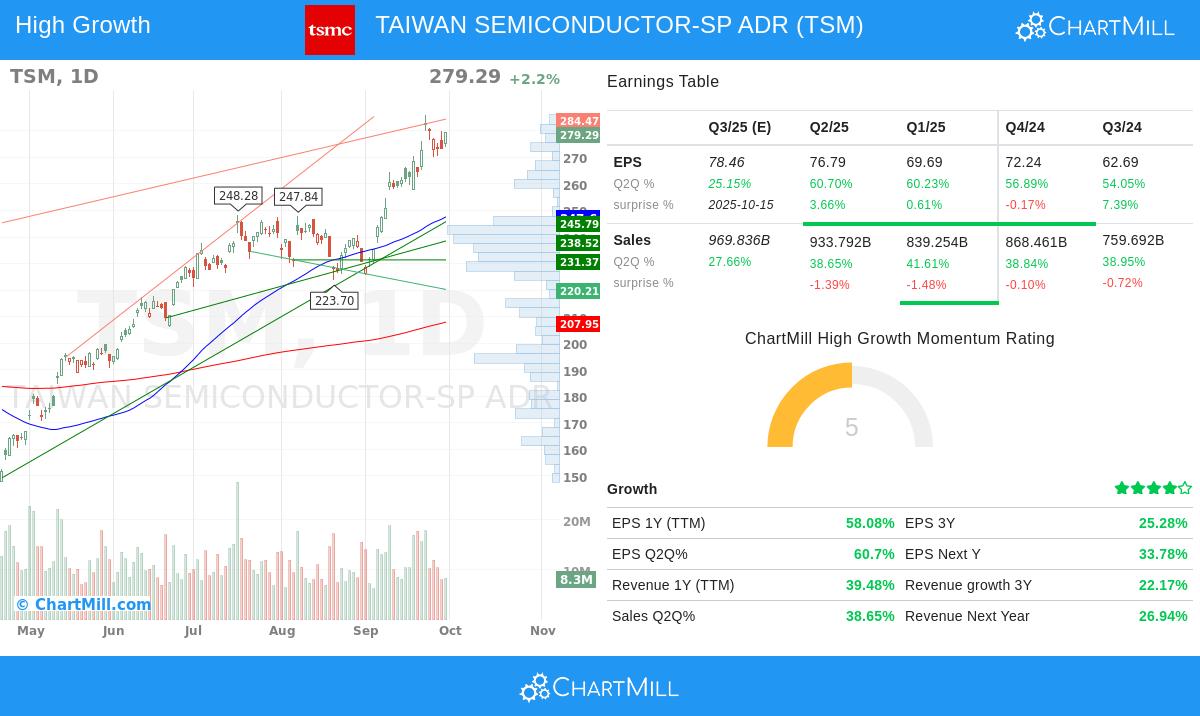
Taiwan Semiconductor Manufacturing Co., Ltd. (NYSE:TSM) shows very good quarterly growth that fits the "C" part of CAN SLIM:
- Quarterly EPS growth of 60.7% year-over-year
- Quarterly revenue growth of 38.6% year-over-year
These numbers are much higher than O'Neil's suggested minimum of 18-20% quarterly earnings growth, pointing to strong current business momentum. The quickening in earnings growth is especially important, as CAN SLIM focuses on not just good growth but also quickening growth patterns.
Annual Earnings Strength
The "A" part looks at consistent annual earnings growth, where TSM continues to do well:
- Three-year EPS compound annual growth rate of 25.3%
- Return on Equity of 31.9%
The company's 25%+ annual EPS growth meets O'Neil's standard for significant growth over several years, while the very good ROE is much higher than the suggested 10% minimum, showing efficient use of shareholder money.
Innovation and Market Position
TSM represents the "N" part with its technology leadership and ongoing innovation:
- Completion of 5nm technology transfer and mass production
- Continued work on 3nm and 2nm process technologies
- Role as the world's top dedicated semiconductor foundry
The company's constant work on smaller process nodes shows the kind of major innovation that CAN SLIM investors look for, creating lasting competitive edges in the fast-moving semiconductor field.
Supply, Demand and Financial Health
For the "S" part, TSM shows positive supply and demand features:
- Debt-to-equity ratio of 0.19, much lower than the maximum level of 2
- Good institutional trading volume and liquidity
- Careful financial structure with acceptable debt levels
The low debt-to-equity ratio points to financial soundness, while the large trading volume provides sufficient market liquidity, both important factors for position traders using the CAN SLIM method.
Market Leadership
TSM's leadership position ("L" part) is clear from several measures:
- Relative strength rating of 88.8, showing it performs better than almost 89% of all stocks
- Field leadership in semiconductor manufacturing technology
- Regular better performance compared to industry competitors
The high relative strength score is especially important in CAN SLIM, as O'Neil stressed investing in market leaders instead of weaker performers, with stocks showing relative strength above 75 seen as particularly interesting.
Institutional Sponsorship
The "I" part looks at institutional ownership levels, where TSM has a good profile:
- Institutional ownership of 36.3%, much lower than the 85% level
- Potential for more institutional accumulation
- Even ownership between institutions and other investors
This ownership setup indicates the possibility of rising institutional buying, unlike stocks where institutions already hold most available shares.
Technical and Fundamental Assessment
From a technical view, TSM displays good momentum with both short-term and long-term trends rated positive. The stock is trading close to 52-week highs with several support levels found, indicating a sound technical position. The technical analysis report points to limited resistance above current price levels.
Fundamentally, TSM gets good ratings for profitability and growth, although valuation seems high by standard measures. The fundamental analysis report notes very good margins and returns on capital, with some worries about current valuation levels being balanced by excellent growth potential.
Market Context
With the S&P 500 displaying positive patterns in both short-term and long-term periods, the overall market direction is good for the CAN SLIM method of investing in growth leaders during upward market times. TSM's good relative performance in this market setting matches the "M" part's focus on market timing.
For investors looking for more CAN SLIM options, our pre-configured screen gives continuous finding of companies meeting these strict growth and momentum standards.
Disclaimer: This analysis is for informational purposes only and does not constitute investment advice, recommendation, or endorsement of any security. Investors should conduct their own research and consult with financial advisors before making investment decisions. Past performance does not guarantee future results.
291.51
+1.55 (+0.53%)
Find more stocks in the Stock Screener
TSM Latest News and Analysis

