
The CAN SLIM investment methodology, created by William O'Neil, integrates fundamental and technical analysis to find high-growth market leaders. This structured process assesses companies using seven main factors represented by the acronym CAN SLIM, concentrating on earnings speed, yearly growth patterns, new products or services, supply-demand forces, market position, institutional backing, and general market conditions. Stocks satisfying these strict standards usually show strong fundamental traits while being traded near their highest prices with notable institutional activity.
Earnings and Sales Momentum
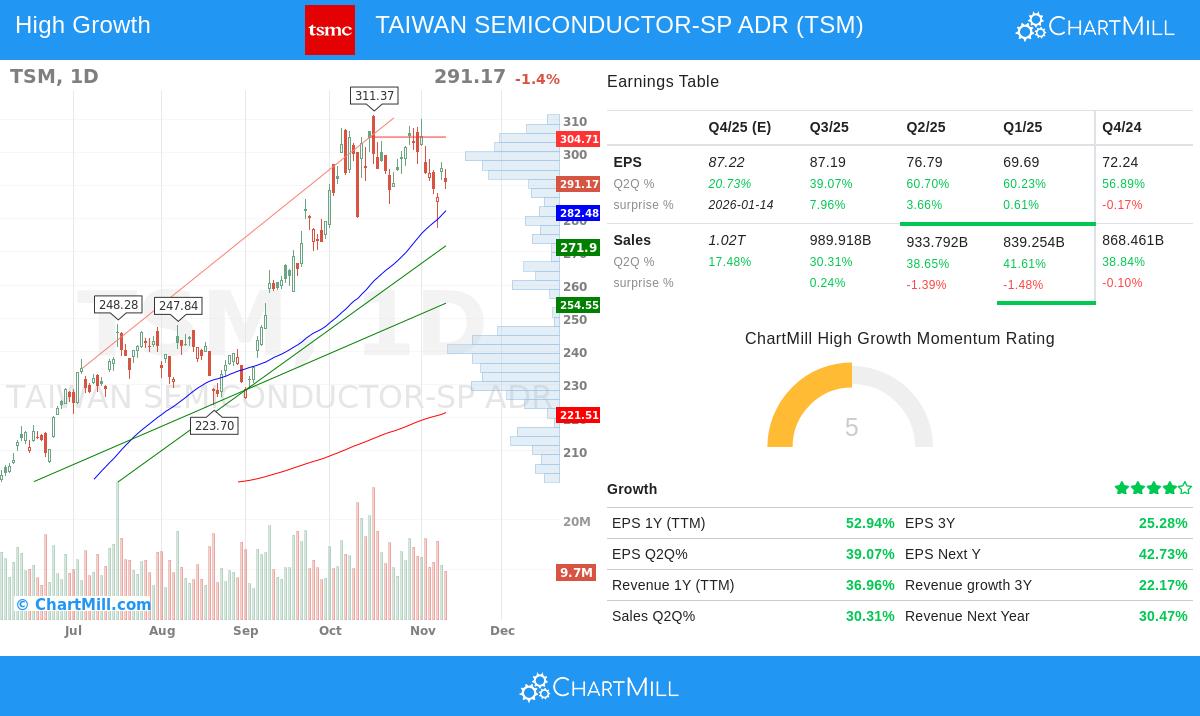
Taiwan Semiconductor Manufacturing-SP ADR (NYSE:TSM) displays strong quarterly results that fit well with the CAN SLIM system's focus on increasing earnings and sales growth. The company's latest quarterly report reveals notable year-over-year progress that goes beyond the methodology's lowest limits:
- Quarterly EPS growth of 39.1% is much higher than the 20-25% minimum needed
- Quarterly revenue growth of 30.3% is above the 25% level
- Both numbers show good momentum in the company's main business activities
These improving quarterly outcomes meet the "C" requirement in CAN SLIM, which looks for companies presenting large or growing quarterly earnings and sales per share. The clear outperformance on both earnings and revenue fronts indicates TSM is performing well in the present market.
Annual Growth and Profitability
The "A" part of CAN SLIM centers on yearly earnings gains, and TSM meets this convincingly. The company has built a history of continued growth that shows its capacity to keep momentum beyond temporary quarterly changes:
- Three-year EPS growth rate of 25.3% meets the system's 25% lowest limit
- Return on Equity of 31.7% is far above the 10% requirement
- Steady profitability over several years with growing margins
These measurements show TSM is not just having short-term success but has established a lasting business structure able to produce significant returns for shareholders. The outstanding ROE is especially notable, putting TSM with the best in its field for effective use of capital.
Market Position and Technical Strength
TSM performs well in the "L" (leader) part of CAN SLIM, showing clear market leadership through both fundamental and technical measures. The company's role as the top dedicated semiconductor foundry worldwide gives it built-in benefits in an industry important to modern technology:
- Relative strength rating of 90.1 shows TSM does better than 90% of all stocks
- Good technical rating of 9/10 with a positive long-term direction
- Top position in semiconductor manufacturing technology
The company's continued work on advanced 3nm and 2nm process technologies meets the "N" requirement for new products and innovation. TSM's technology plan keeps it at the front of semiconductor manufacturing, offering advanced solutions to customers in computing, communications, and consumer electronics.
Financial Health and Institutional Support
TSM keeps a balance sheet that allows for continued growth while handling risk suitably. The company's financial numbers match well with CAN SLIM's focus on maintainable expansion:
- Debt-to-equity ratio of 0.18 is much lower than the highest limit of 2.0
- Institutional ownership of 36.3% offers backing while allowing space for more institutional buying
- Good liquidity position with current ratio of 2.69
The reasonable institutional ownership level is particularly important, as it hints at the possibility for more institutional purchasing as additional funds learn about the company's solid fundamentals and growth path. This meets the "I" requirement while preventing the saturation that can happen in stocks with very high ownership.
Complete Analysis View
According to ChartMill's fundamental analysis report, TSM gets a good rating of 7/10, with excellent profitability scores balanced by valuation questions. The technical analysis gives an even better view, with a technical rating of 9/10 pointing to good price momentum and market relative strength. The stock is now traded in the higher part of its 52-week range, although it displays some recent sideways movement that could offer possible entry points for CAN SLIM investors.
While TSM shows many traits liked by the CAN SLIM methodology, investors should think about the wider market situation, the "M" requirement, which stresses investing in agreement with total market conditions. With the S&P 500 displaying a positive short-term direction, the setting seems favorable for CAN SLIM choices like TSM.
Looking at More Opportunities
For investors wanting to find other companies that fit CAN SLIM criteria, more screening results can be found using the pre-configured CAN SLIM screener. This tool enables more personalization based on individual risk comfort and investment choices.
Disclaimer: This analysis is for information only and is not investment advice, a suggestion, or a support of any security. Investors should do their own research and talk to financial advisors before making investment choices. Past results do not ensure future outcomes.