Taiwan Semiconductor (NYSE:TSM) Screens as a Strong CAN SLIM Candidate
By Mill Chart
Last update: Sep 10, 2025
In the world of growth investing, few methods have gained the lasting recognition of William O’Neil’s CAN SLIM system. This plan, described in his important book "How to Make Money in Stocks," mixes strict fundamental study with chart-based signals to find top companies ready for major price gains. The system’s letters explain its main ideas: strong Current quarterly earnings, solid Annual earnings increases, a focus on New goods or market highs, attention to Supply and demand forces, market Leadership, Institutional backing, and matching the general Market trend. By filtering for stocks that fit these points, investors try to find high-growth chances during rising market periods.
Earnings and Sales Momentum
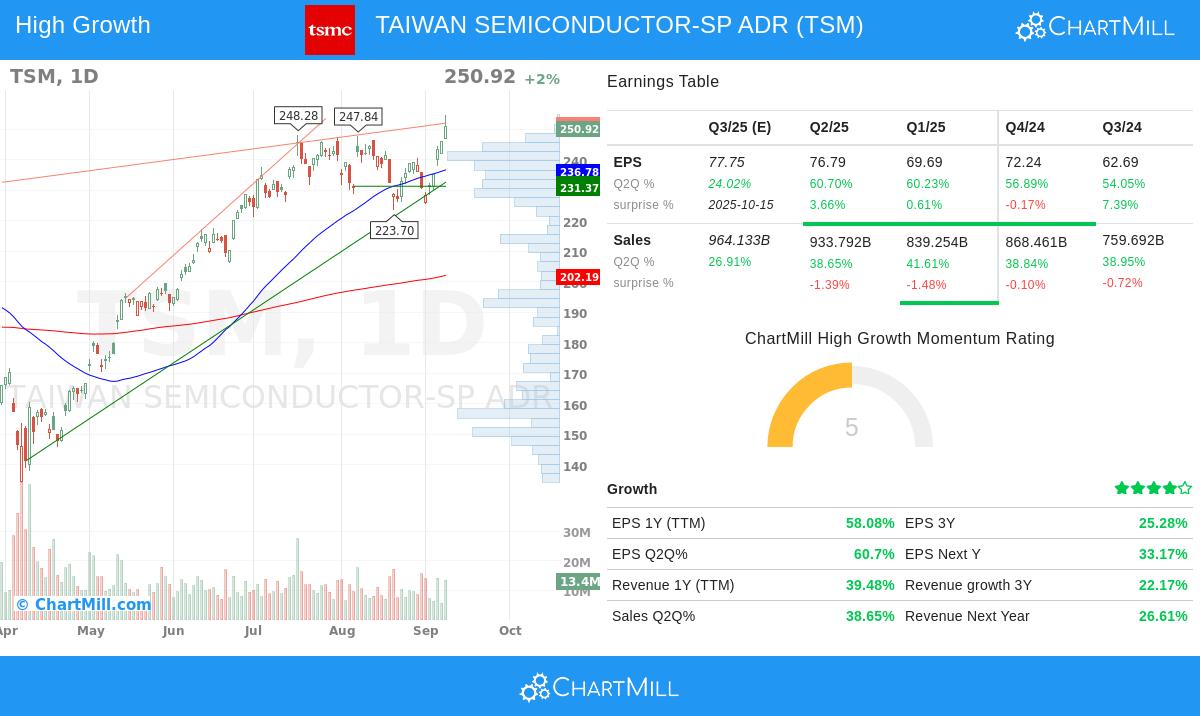
A key part of the CAN SLIM method is finding companies with very strong quarterly earnings and sales speed. Taiwan Semiconductor Manufacturing Co., Ltd. (NYSE:TSM) shows notable numbers here:
- Quarterly EPS growth rose 60.7% year-over-year
- Quarterly revenue grew by 38.6% compared to the same quarter last year
These results are much higher than O’Neil’s proposed lowest level of 18-20% growth, showing strong business speed. The major rise in both earnings and sales implies the company is benefiting from good industry conditions and performing well in its market area.
Annual Growth and Profitability
The system highlights continued yearly earnings growth and high profitability measures. TSM shows very good performance in these aspects:
- Three-year EPS compound annual growth rate of 25.3%
- Return on equity of 31.9%, much above the 10% lowest level
- Operating margin of 48.7%, placed in the top group of semiconductor competitors
These numbers show not only short-term wins but set operational quality. The high ROE shows good use of shareholder money, while the steady earnings growth shows the company's skill to increase profits over several years, a main need for CAN SLIM picks.
Market Position and Technical Strength
CAN SLIM chooses market leaders showing better performance and institutional support. TSM does very well here:
- Relative strength score of 86.5, meaning it does better than 86.5% of all stocks
- Institutional ownership of 34.5%, much under the 85% level that could mean little room to rise
- Recent new 52-week highs, confirming chart-based speed
The stock's better performance against both the wider market and its semiconductor competitors matches O’Neil's focus on market leadership. The fair institutional ownership level implies space for more institutional buying, which might give more price help.
Financial Health and Risk Considerations
The system prefers companies with good financial setups. TSM keeps:
- Debt-to-equity ratio of 0.19, much under the highest 2.0 level
- Current ratio of 2.37, showing strong short-term cash availability
- Careful payout ratio of 28.4%, keeping earnings for growth projects
These measures show a financially careful company with enough ability to fund future growth without high borrowing. The low debt level gives room during industry changes and lowers money risk, a key point given the high-cost nature of semiconductor production.
Technical and Fundamental Assessment
The mixed chart-based and fundamental view supports the CAN SLIM idea. On the chart, TSM shows both short and long-term good directions, trading near 52-week highs with strong speed traits. The stock has shown very good performance over many time periods, with a 45.5% increase over the last year. On fundamentals, the company gets 6 out of 10 in our rating plan, with special force in profitability (score 9) and growth (score 8) groups. While price seems high next to past measures, this is partly explained by the company's unusual growth path and industry leading spot.
For a full chart-based study, readers can see the full technical report, while the detailed fundamental analysis gives more depth on financial measures.
Market Context and Implementation
The present market situation, with both short and long-term S&P 500 directions positive, gives a good setting for CAN SLIM plans. TSM's mix of strong fundamental growth traits and positive chart-based speed fits well with the system's needs. Investors using this method would usually watch for good entry points during pauses or dips within the general upward trend, using firm stop-loss orders to control risk.
For investors wanting to find more companies that fit CAN SLIM points, our pre-set screener offers a beginning for spotting other possible picks that show similar growth and speed traits.
,
Disclaimer: This study is given for information only and is not investment guidance, a suggestion, or a deal to buy or sell any securities. Investors should do their own study and talk with a skilled financial advisor before making investment choices. Past results do not show future outcomes.
290.62
-0.55 (-0.19%)
Find more stocks in the Stock Screener
TSM Latest News and Analysis