Tesla Inc (NASDAQ:TSLA) Demonstrates Strong Technical and Setup Ratings for Potential Breakout
By Mill Chart
Last update: Sep 5, 2025
Technical breakout strategies aim to identify stocks that are both technically strong and forming consolidation patterns, offering potential entry points for momentum-based trades. This approach combines two key metrics: the Technical Rating, which measures overall trend strength and health, and the Setup Rating, which evaluates the quality of consolidation patterns and potential entry/exit points. Stocks scoring highly on both metrics often present noteworthy opportunities for technical traders seeking breakout candidates.
TESLA INC (NASDAQ:TSLA) currently demonstrates characteristics that align with this breakout methodology, showing both technical strength and consolidation patterns that may interest momentum-focused investors.
Technical Strength Assessment
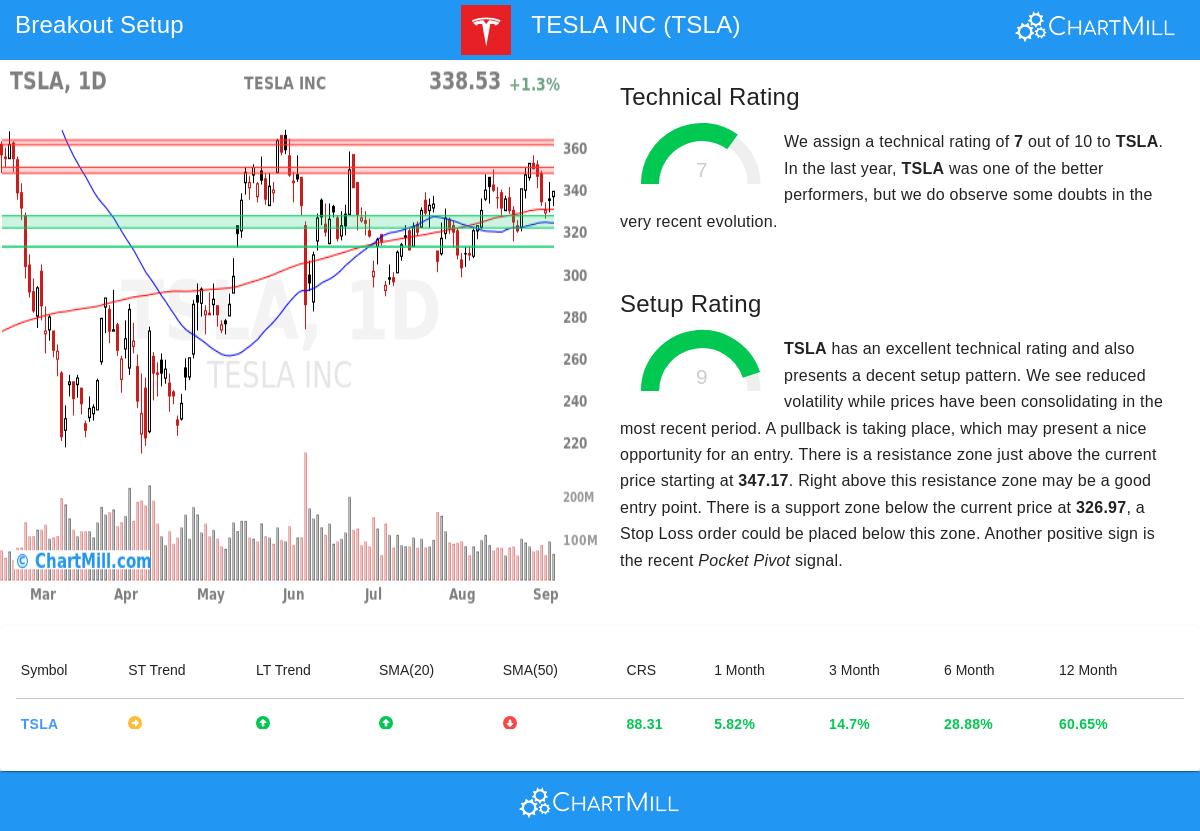
Tesla's technical foundation appears solid, earning a Technical Rating of 7 out of 10 according to the detailed technical analysis report. This rating reflects several positive factors that contribute to the stock's technical health:
- The long-term trend remains positive while the short-term trend shows neutrality, suggesting potential for trend continuation
- Strong relative strength within the automobile industry, outperforming 86% of sector peers
- Multiple moving averages providing support, with the 20-day, 100-day, and 200-day SMAs all in rising configurations
- Year-to-date performance showing significant outperformance compared to 88% of all market stocks
The Technical Rating is crucial for breakout strategies because it identifies stocks with established upward momentum. Stocks with ratings above 7 typically demonstrate sustained uptrends, making them more likely to continue their positive trajectory following consolidation periods.
Setup Quality Evaluation
Tesla's setup characteristics appear particularly strong, achieving a Setup Rating of 9 out of 10. This high score indicates excellent consolidation quality and potential entry opportunity:
- Recent trading within a defined range between $314.60 and $355.39, with current prices positioned in the middle of this consolidation zone
- Reduced volatility patterns suggesting tightening price action
- Multiple identified support zones, with the strongest ranging from $321.22 to $326.97
- Recent pocket pivot signal indicating institutional accumulation
- Clear resistance zones identified between $347.17,$349.99 and $360.56,$362.90
The Setup Rating matters because it identifies stocks that have paused their advance to build energy for the next potential move. High setup scores typically indicate stocks that have consolidated sufficiently to offer favorable risk-reward ratios with clearly defined support and resistance levels.
Trading Considerations
For technical traders considering Tesla as a breakout candidate, several factors warrant attention:
- Potential entry above $350.00, just above the identified resistance zone
- Stop loss consideration below $321.21, beneath the primary support area
- Risk management suggesting approximately 8.23% position risk
- High daily average volume of 86.7 million shares ensuring adequate liquidity
- Current ATR of 3.48% indicating moderate volatility conditions
The combination of solid technical foundation and excellent setup quality makes Tesla an interesting candidate for technical breakout strategies. However, traders should note that the stock currently trades in the middle of its 52-week range while the broader market approaches new highs, suggesting some relative weakness compared to market leaders.
Finding Additional Opportunities
Technical breakout setups like Tesla's can be identified daily through systematic screening. The Technical Breakout Setups screen regularly identifies stocks meeting similar criteria of strong technical ratings combined with high-quality setup patterns, providing traders with a curated list of potential breakout candidates across various sectors and market capitalizations.
Disclaimer: This analysis is for informational purposes only and should not be construed as investment advice. Technical analysis involves risk, and past performance does not guarantee future results. Always conduct your own research and consider your risk tolerance before making any investment decisions.
440.4
+17.01 (+4.02%)
Find more stocks in the Stock Screener
TSLA Latest News and Analysis