
In today's market environment, where both short and long-term trends for the S&P 500 remain positive, investors are increasingly seeking opportunities that combine strong fundamental growth with sound technical patterns. One approach gaining traction is the use of multi-factor screens that identify stocks with high growth momentum, solid technical health, and favorable setup conditions. This strategy integrates elements from methodologies like CANSLIM and Minervini, focusing on companies demonstrating accelerating earnings, upward revisions, and consolidating price patterns, key indicators that often precede significant breakouts.
SOFI TECHNOLOGIES INC (NASDAQ:SOFI) appears as a notable candidate from such a screen, which filtered for securities with a High Growth Momentum Rating above 4, a Technical Rating above 7, and a Setup Rating above 7. This combination aims to pinpoint firms not only growing quickly but also showing technical strength and actionable entry points.
High Growth Momentum Fundamentals
SOFI’s fundamental profile aligns strongly with the criteria emphasized in high growth momentum investing. The company has shown notable earnings expansion and operational momentum, critical factors for investors targeting accelerated growth.
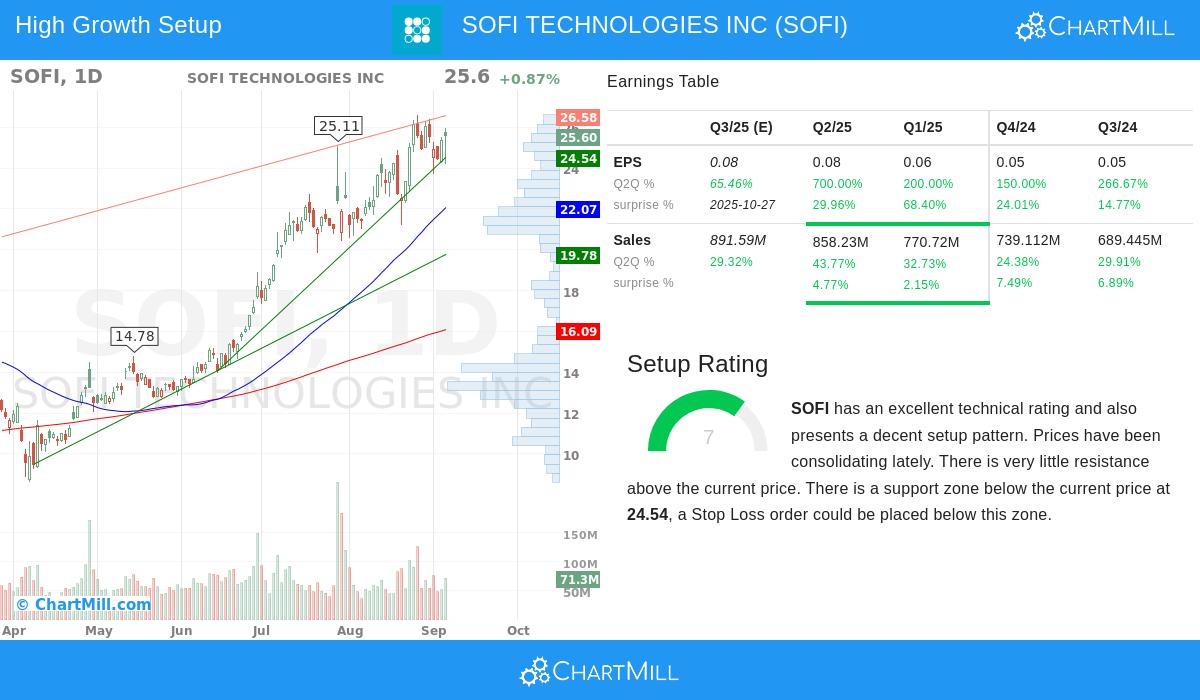
- EPS Growth: Trailing twelve-month EPS surged by approximately 1,100%, with recent quarterly growth rates reaching 700% year-over-year in the most recent quarter, followed by 200% and 150% in prior quarters. This acceleration in profitability highlights operational efficiency and scaling success.
- Revenue Performance: Sales growth remains solid, with a 43.8% increase in the last quarter and a TTM revenue growth of 27.6%. The consistency here, alongside a 4-quarter streak of revenue estimate beats averaging 5.33%, points to reliable execution.
- Analyst Revisions: Positive sentiment is reinforced by upward revisions, with next-year EPS estimates revised higher by 12.67% over three months, indicating growing confidence in sustained performance.
- Profit Margins: The latest quarter reported a profit margin of 11.38%, up from 9.21% in the prior quarter, reflecting improving profitability despite investments in growth.
These metrics are central to the High Growth Momentum Rating, as they capture not just historical growth but its velocity, sustainability, and recognition by analysts, key for avoiding value traps and catching emerging leaders early.
Technical Strength and Setup Quality
From a technical perspective, SOFI shows excellent health and a promising setup pattern. According to its technical analysis report, the stock earns a perfect Technical Rating of 10, reflecting superior relative strength, trend alignment, and market leadership.
- Trend Performance: Both short and long-term trends are positive, with the stock outperforming 98% of all stocks over the past year and 96% of its Consumer Finance industry peers. It is trading near 52-week highs, signaling strength in line with the broader market uptrend.
- Consolidation Pattern: The Setup Rating of 7 indicates a consolidation phase, characterized by a bull flag pattern, a pause following strong upward moves, which often precedes further advances. Support is firm around $24.54, providing a logical area for stop-loss orders.
- Volume and Liquidity: Average daily volume of 74.6 million shares ensures high liquidity, reducing slippage risks for entries and exits.
This technical backdrop is vital for timing entries, as it helps investors avoid overextended stocks and instead focus on those in consolidation, positioned for their next leg up.
Investment Implications
For growth momentum investors, SOFI represents a combination of accelerating fundamentals and technically sound positioning. The high growth metrics satisfy the need for earnings and sales momentum, while the technical setup offers a structured risk-management framework. Importantly, the stock’s pattern suggests a potential breakout above $26.62, with support levels providing clear downside protection.
It is worth noting that while free cash flow remains negative, the strong EPS growth and margin expansion indicate a path toward profitability, a common trait in high-growth companies prioritizing scale.
Explore More Opportunities
For investors interested in similar high-growth, technically positioned stocks, further results can be explored using this specialized screen.
Disclaimer: This article is for informational purposes only and does not constitute investment advice. Investors should conduct their own research and consider their risk tolerance before making any investment decisions.