
Investors seeking growth at a reasonable cost should explore SUPER MICRO COMPUTER INC (NASDAQ:SMCI).
By Mill Chart
Last update: Mar 24, 2025
SUPER MICRO COMPUTER INC (NASDAQ:SMCI) has caught the eye of our stock screener as an affordable growth stock. SMCI is displaying robust growth metrics and also excels in terms of profitability, solvency, and liquidity. Additionally, it appears to be reasonably priced. Let's delve into the details.
Growth Assessment of SMCI
ChartMill assigns a Growth Rating to every stock. This score ranges from 0 to 10 and evaluates the different growth aspects like EPS and Revenue, both in the past as in the future. SMCI scores a 8 out of 10:
- The Earnings Per Share has grown by an impressive 85.95% over the past year.
- The Earnings Per Share has been growing by 66.56% on average over the past years. This is a very strong growth
- The Revenue has grown by 125.01% in the past year. This is a very strong growth!
- The Revenue has been growing by 33.76% on average over the past years. This is a very strong growth!
- Based on estimates for the next years, SMCI will show a very strong growth in Earnings Per Share. The EPS will grow by 22.05% on average per year.
- The Revenue is expected to grow by 9.60% on average over the next years. This is quite good.
Unpacking SMCI's Valuation Rating
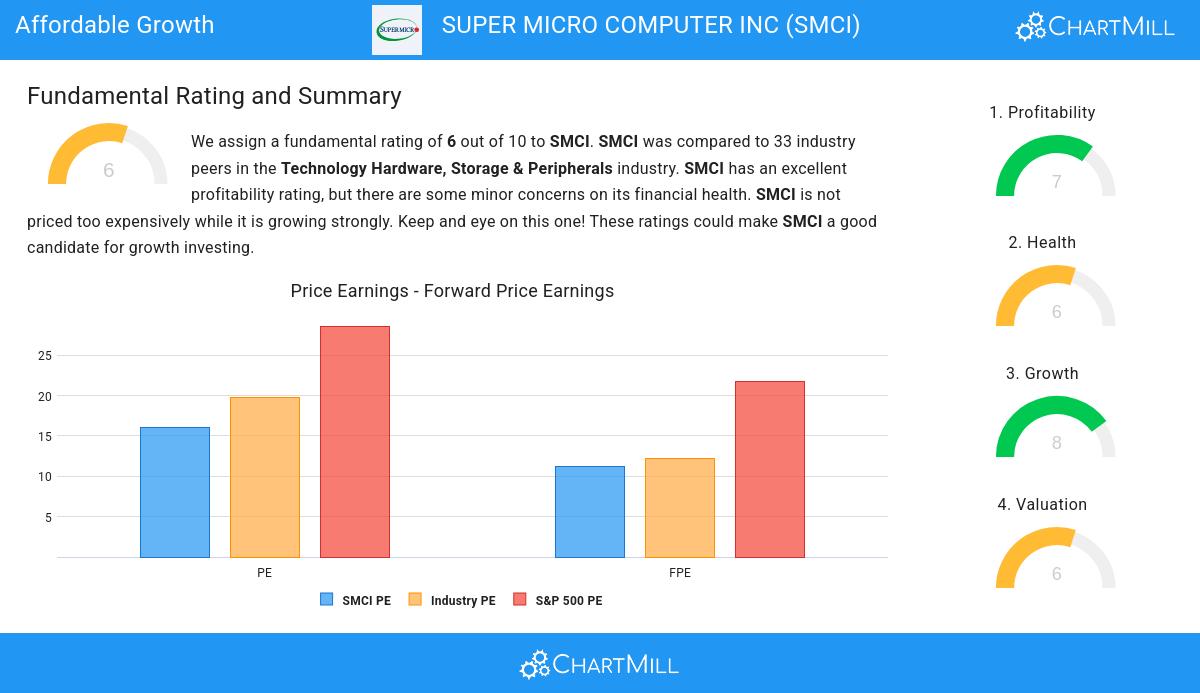
An integral part of ChartMill's stock analysis is the Valuation Rating, which spans from 0 to 10. This rating evaluates diverse valuation factors, including price to earnings and cash flows, while considering the stock's profitability and growth. SMCI has received a 6 out of 10:
- Based on the Price/Earnings ratio, SMCI is valued a bit cheaper than the industry average as 66.67% of the companies are valued more expensively.
- The average S&P500 Price/Earnings ratio is at 28.62. SMCI is valued slightly cheaper when compared to this.
- SMCI is valuated reasonably with a Price/Forward Earnings ratio of 11.26.
- Based on the Price/Forward Earnings ratio, SMCI is valued a bit cheaper than 63.64% of the companies in the same industry.
- SMCI is valuated rather cheaply when we compare the Price/Forward Earnings ratio to 21.72, which is the current average of the S&P500 Index.
- SMCI's Enterprise Value to EBITDA ratio is a bit cheaper when compared to the industry. SMCI is cheaper than 63.64% of the companies in the same industry.
- SMCI's low PEG Ratio(NY), which compensates the Price/Earnings for growth, indicates a rather cheap valuation of the company.
- The decent profitability rating of SMCI may justify a higher PE ratio.
- SMCI's earnings are expected to grow with 22.05% in the coming years. This may justify a more expensive valuation.
Looking at the Health
A critical element of ChartMill's stock evaluation is the Health Rating, which spans from 0 to 10. This rating considers multiple health factors, including liquidity and solvency, both in absolute terms and relative to industry peers. SMCI has received a 6 out of 10:
- An Altman-Z score of 8.35 indicates that SMCI is not in any danger for bankruptcy at the moment.
- Looking at the Altman-Z score, with a value of 8.35, SMCI belongs to the top of the industry, outperforming 90.91% of the companies in the same industry.
- SMCI has a Debt/Equity ratio of 0.28. This is a healthy value indicating a solid balance between debt and equity.
- SMCI has a Debt to Equity ratio of 0.28. This is in the better half of the industry: SMCI outperforms 60.61% of its industry peers.
- SMCI has a Current Ratio of 6.38. This indicates that SMCI is financially healthy and has no problem in meeting its short term obligations.
- SMCI has a better Current ratio (6.38) than 96.97% of its industry peers.
- SMCI has a Quick Ratio of 3.73. This indicates that SMCI is financially healthy and has no problem in meeting its short term obligations.
- SMCI has a better Quick ratio (3.73) than 93.94% of its industry peers.
Assessing Profitability for SMCI
ChartMill assigns a Profitability Rating to every stock. This score ranges from 0 to 10 and evaluates the different profitability ratios and margins, both absolutely, but also relative to the industry peers. SMCI scores a 7 out of 10:
- SMCI has a Return On Assets of 14.85%. This is amongst the best in the industry. SMCI outperforms 93.94% of its industry peers.
- With an excellent Return On Equity value of 23.16%, SMCI belongs to the best of the industry, outperforming 90.91% of the companies in the same industry.
- With a decent Return On Invested Capital value of 16.62%, SMCI is doing good in the industry, outperforming 75.76% of the companies in the same industry.
- The Average Return On Invested Capital over the past 3 years for SMCI is above the industry average of 16.21%.
- The last Return On Invested Capital (16.62%) for SMCI is well below the 3 year average (20.63%), which needs to be investigated, but indicates that SMCI had better years and this may not be a problem.
- The Profit Margin of SMCI (6.94%) is better than 78.79% of its industry peers.
- SMCI's Profit Margin has improved in the last couple of years.
- SMCI's Operating Margin of 7.42% is fine compared to the rest of the industry. SMCI outperforms 63.64% of its industry peers.
- In the last couple of years the Operating Margin of SMCI has grown nicely.
Our Affordable Growth screener lists more Affordable Growth stocks and is updated daily.
Check the latest full fundamental report of SMCI for a complete fundamental analysis.
Disclaimer
This article should in no way be interpreted as advice. The article is based on the observed metrics at the time of writing, but you should always make your own analysis and trade or invest at your own responsibility.
31.11
+1.74 (+5.92%)
Find more stocks in the Stock Screener
SMCI Latest News and Analysis


