
Investors should take note of NVIDIA CORP (NASDAQ:NVDA), a growth stock that remains attractively priced.
By Mill Chart
Last update: Apr 10, 2025
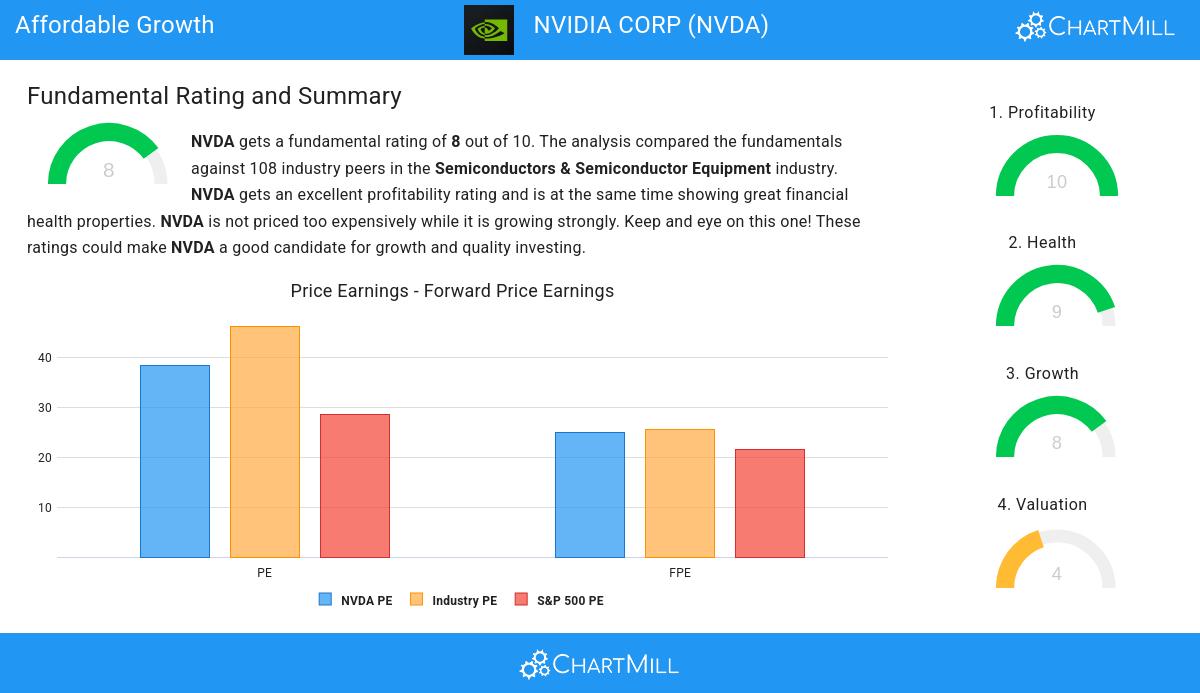
Our stock screener has spotted NVIDIA CORP (NASDAQ:NVDA) as a growth stock which is not overvalued. NVDA is scoring great on several growth aspects while it also shows decent health and profitability. At the same time it remains remains attractively priced. We'll dive into each aspect below.
Growth Insights: NVDA
ChartMill employs its own Growth Rating system for all stocks. This score, ranging from 0 to 10, is derived by evaluating different growth factors, such as EPS and revenue growth, taking into account both past performance and future projections. NVDA has earned a 8 for growth:
- NVDA shows a strong growth in Earnings Per Share. In the last year, the EPS has been growing by 130.69%, which is quite impressive.
- NVDA shows a strong growth in Earnings Per Share. Measured over the last years, the EPS has been growing by 83.26% yearly.
- Looking at the last year, NVDA shows a very strong growth in Revenue. The Revenue has grown by 114.20%.
- NVDA shows a strong growth in Revenue. Measured over the last years, the Revenue has been growing by 64.24% yearly.
- Based on estimates for the next years, NVDA will show a quite strong growth in Earnings Per Share. The EPS will grow by 19.05% on average per year.
- Based on estimates for the next years, NVDA will show a quite strong growth in Revenue. The Revenue will grow by 19.11% on average per year.
Valuation Assessment of NVDA
An integral part of ChartMill's stock analysis is the Valuation Rating, which spans from 0 to 10. This rating evaluates diverse valuation factors, including price to earnings and cash flows, while considering the stock's profitability and growth. NVDA has received a 4 out of 10:
- NVDA's low PEG Ratio(NY), which compensates the Price/Earnings for growth, indicates a rather cheap valuation of the company.
- The excellent profitability rating of NVDA may justify a higher PE ratio.
- NVDA's earnings are expected to grow with 31.45% in the coming years. This may justify a more expensive valuation.
Deciphering NVDA's Health Rating
ChartMill employs its own Health Rating for stock assessment. This rating, ranging from 0 to 10, is calculated by examining various liquidity and solvency ratios. In the case of NVDA, the assigned 9 reflects its health status:
- An Altman-Z score of 56.98 indicates that NVDA is not in any danger for bankruptcy at the moment.
- Looking at the Altman-Z score, with a value of 56.98, NVDA belongs to the top of the industry, outperforming 98.15% of the companies in the same industry.
- The Debt to FCF ratio of NVDA is 0.14, which is an excellent value as it means it would take NVDA, only 0.14 years of fcf income to pay off all of its debts.
- NVDA has a better Debt to FCF ratio (0.14) than 85.19% of its industry peers.
- A Debt/Equity ratio of 0.11 indicates that NVDA is not too dependend on debt financing.
- A Current Ratio of 4.44 indicates that NVDA has no problem at all paying its short term obligations.
- NVDA has a Current ratio of 4.44. This is in the better half of the industry: NVDA outperforms 68.52% of its industry peers.
- NVDA has a Quick Ratio of 3.88. This indicates that NVDA is financially healthy and has no problem in meeting its short term obligations.
- NVDA has a better Quick ratio (3.88) than 72.22% of its industry peers.
What does the Profitability looks like for NVDA
Discover ChartMill's exclusive Profitability Rating, a proprietary metric that assesses stocks on a scale of 0 to 10. It takes into consideration various profitability ratios and margins, both in absolute terms and relative to industry peers. Notably, NVDA has achieved a 10:
- The Return On Assets of NVDA (65.30%) is better than 99.07% of its industry peers.
- With an excellent Return On Equity value of 91.87%, NVDA belongs to the best of the industry, outperforming 99.07% of the companies in the same industry.
- Looking at the Return On Invested Capital, with a value of 76.63%, NVDA belongs to the top of the industry, outperforming 100.00% of the companies in the same industry.
- The Average Return On Invested Capital over the past 3 years for NVDA is significantly above the industry average of 11.60%.
- The 3 year average ROIC (48.58%) for NVDA is below the current ROIC(76.63%), indicating increased profibility in the last year.
- NVDA has a better Profit Margin (55.85%) than 97.22% of its industry peers.
- In the last couple of years the Profit Margin of NVDA has grown nicely.
- NVDA's Operating Margin of 62.88% is amongst the best of the industry. NVDA outperforms 100.00% of its industry peers.
- In the last couple of years the Operating Margin of NVDA has grown nicely.
- Looking at the Gross Margin, with a value of 75.45%, NVDA belongs to the top of the industry, outperforming 93.52% of the companies in the same industry.
- NVDA's Gross Margin has improved in the last couple of years.
Every day, new Affordable Growth stocks can be found on ChartMill in our Affordable Growth screener.
Check the latest full fundamental report of NVDA for a complete fundamental analysis.
Keep in mind
This is not investing advice! The article highlights some of the observations at the time of writing, but you should always make your own analysis and invest based on your own insights.
186.5
-1.04 (-0.55%)
Find more stocks in the Stock Screener
NVDA Latest News and Analysis


