
Norwegian Cruise Line Holdings Ltd. (NYSE:NCLH) has appeared as a notable candidate in a recent technical breakout screen, which finds stocks showing both good underlying technical condition and positive consolidation patterns. This method uses ChartMill’s own Technical Rating and Setup Quality Rating to find equities that are not only in good uptrends but also creating practical entry points. The process is made to help investors find chances where momentum and timing come together, lowering guesswork and focusing on disciplined, rule-based review.
Technical Condition
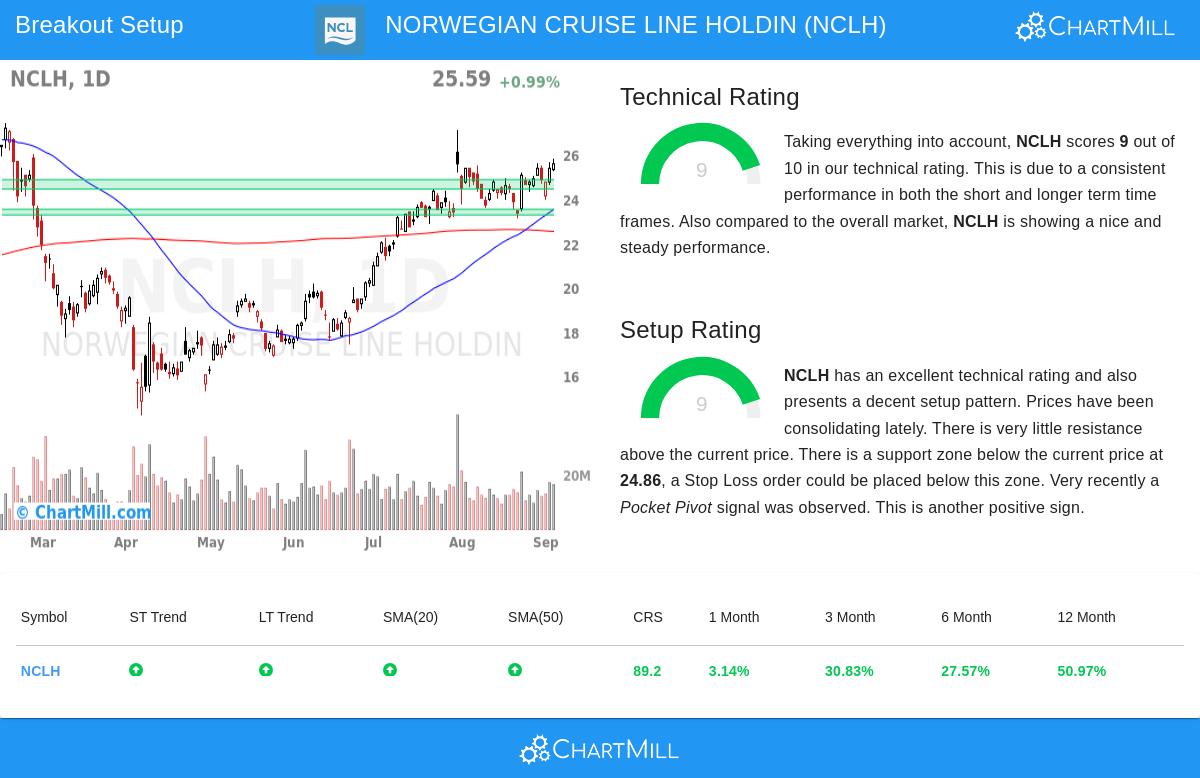
Norwegian Cruise Line Holdings shows very good technical energy, getting a near-maximum Technical Rating of 9 out of 10. This number shows condition across multiple timeframes and technical measures. Both its short-term and long-term trends are good, showing continued buyer interest and momentum. The stock is priced above important moving averages, including the 20-day, 50-day, and 100-day SMAs, which are all moving up, a typical sign of a good uptrend. Also, NCLH shows good relative condition, doing better than 82% of stocks in the Hotels, Restaurants & Leisure industry. This kind of technical soundness is important for breakout plans, as it shows the stock is in a leading position and less likely to sudden turns.
Key technical points include:
- Good short-term and long-term trends
- Price above rising 20-day, 50-day, and 100-day moving averages
- One-year gain of about 51%, doing better than 89% of stocks
- Good volume profile, with average daily volume close to 14.4 million shares
Setup Condition
Adding to its technical condition, NCLH shows a high-grade consolidation pattern, shown in a Setup Rating of 9. The stock has been trading inside a set range between about $23.13 and $25.79 over the last month, showing lower volatility and forming a base near the top of this range. This kind of price action often comes before a possible breakout, as it shows balance between buyers and sellers before a new move higher. The setup is further supported by a recent Pocket Pivot signal, a volume-based measure suggesting institutional buying. For breakout traders, these conditions help find lower-risk entry points, with clearly set support levels for stop-loss orders.
Notable setup details:
- Narrow consolidation near the high of a one-month range
- Several support areas, with the closest located around $24.86
- Pocket Pivot signal showing positive volume activity
- Little overhead resistance, with the next important level around $28.35
Trade Points
Based on the technical and setup measures, a sample breakout trade could include an entry above $25.80, which would show a move above recent consolidation highs. A stop-loss order set below the nearest support near $24.42 would help control risk, meaning a possible loss of about 5.35% on the trade. It is important to note that while the automated review suggests these levels, traders should always check with their own risk comfort and market situation. The existence of a well-set support structure and good technical background increases the chance of a good breakout, though no setup is without risk.
Finding Other Chances
For investors looking to review other technical breakout candidates, the Technical Breakout Setups screen offers a daily-updated list of stocks meeting similar conditions. This tool can help find other equities with high Technical and Setup Ratings, giving a efficient way to locate possible chances across the market.
,
Disclaimer: This article is for informational purposes only and does not constitute investment advice. The analysis is based on technical metrics and historical data, which may not guarantee future performance. Investors should conduct their own research and consider their risk tolerance before making any trading decisions.