Market Monitor May 2 ( Microsoft, Meta UP - Eli Lilly DOWN)
By Kristoff De Turck - reviewed by Aldwin Keppens
Last update: May 2, 2025

Wall Street Rebounds as Microsoft and Meta Impress, Eyes Turn to Jobs Report and Tariff Tensions
U.S. stocks kicked off May with strong gains on Thursday, as investors cheered impressive earnings reports from Microsoft and Meta Platforms. The tech-heavy Nasdaq led the charge, climbing 1.5%, while the S&P 500 rose 0.6% and the Dow Jones Industrial Average added 0.2%.
The rebound followed Wednesday’s losses, which were sparked by data revealing a contraction in the U.S. economy during the first quarter.
Concerns lingered over the potential economic fallout from ongoing trade tensions, particularly regarding import tariffs originally introduced during the Trump administration. Reports surfaced that the U.S. may be reopening talks with China about these tariffs, offering a glimmer of hope to nervous investors.
Microsoft and Meta Shine
Microsoft (MSFT | +7.63%) surged 7.6% after delivering blowout earnings across all segments, with its Azure cloud division standing out. Azure posted a 35% year-over-year growth (adjusted for currency effects), handily beating analyst expectations of around 30-31%.
Analysts at Evercore described the tech giant as a “stock for all seasons,” emphasizing its resilience and ability to thrive in diverse market conditions. Morgan Stanley echoed this sentiment, highlighting strong performance across all business units.
Meta Platforms (META | +4.23%) also exceeded expectations, sending its stock up 4.2%. The company showcased robust revenue and profit growth, driven by AI-powered improvements in user engagement and ad revenue. Meta’s operating margin reached its highest level forrst quarter in four years.
Wall Street responded positively: JPMorgan raised its price target to $675, citing clear communication about the returns on AI investments, while Morgan Stanley bumped its target to $650.
Broader Market Movers
Nvidia (NVDA | +2.47%) gained 2.5%, buoyed by the broader tech rally and speculation that potential easing of export restrictions could benefit its chip business in the Middle East.
Tesla (TSLA |-0.58%) dipped 0.6% amid reports—later denied—that its board is seeking a successor to CEO Elon Musk.
On the downside, Eli Lilly (LLY | -11.66%) tumbled 11.7% after slashing its full-year earnings forecast due to rising R&D costs and competitive pressures. The announcement of a new deal between CVS Health and Novo Nordisk could also dent sales of Eli Lilly’s weight-loss drug, Zepbound.
McDonald’s (MCD |-1.88%) fell nearly 2% after posting weaker-than-expected earnings. Comparable U.S. sales dropped 3.6% as consumer sentiment continued to weaken, marking the second consecutive quarterly decline.
GeneralMotors (GM | 0.42%) shed 0.4% aftering lowering its full-year profit outlook, citing a potential $5 billion impact from tariffs. Meanwhile, Harley-Davidson jumped 2.8% despite pulling its guidance for the year, attributing the move to economic uncertainty and import cost pressures.
Economic Snapshot
Thursday’s macroeconomic data painted a mixed picture. Weekly jobless claims rose to 241,000, above the expected 225,000, suggesting some softening in the labor market.
On the manufacturing front, the S&P Global PMI held steady at 50.2, indicating slight growth, while the ISM manufacturing index unexpectedly fell to 48.7, still signaling contraction, but less severe than forecast.
Investors now turn their focus to Friday’s all-important jobs report. Economists expect the U.S. economy to have added 133,000 new jobs in April, down from 228,000 in March, with unemployment holding steady at 4.2% and wage growth ticking higher.
Oil and Currency Markets
After an early drop driven by oversupply concerns and economic uncertainty, oil prices rebounded during the session. WTI crude ended the day up 1.8% at $59.24 per barrel. The 10-year U.S. Treasury yield rose to 4.229%, while the euro weakened 0.4% against the dollar, settling at 1.1290.
Bottom Line
Optimism from strong tech earnings helped Wall Street shake off recession worries and a shaky start to the week. However, looming trade uncertainties, macroeconomic headwinds, and Friday’s jobs data could quickly shift investor sentiment again.
Daily Market Analysis – May 1, 2025 (After Market Close)
Short Term Trend

- Short-Term Trend: Bullish (no change)
- Support at $550
- Resistance at $580
- Volume: Slightly below average (50)
- Pattern: Gap Up and Doji Candle
- Short-Term Trend: Bullish (no change)
- Support at $470
- Resistance at $490
- Volume: Slightly below average (50)
- Pattern: Gap Up and Doji Candle
- Short-Term Trend: Neutral (no change)
- Support at $170
- Resistance at $197
- Volume: Slightly below average (50)
- Pattern: Doji candle
Long Term Trend
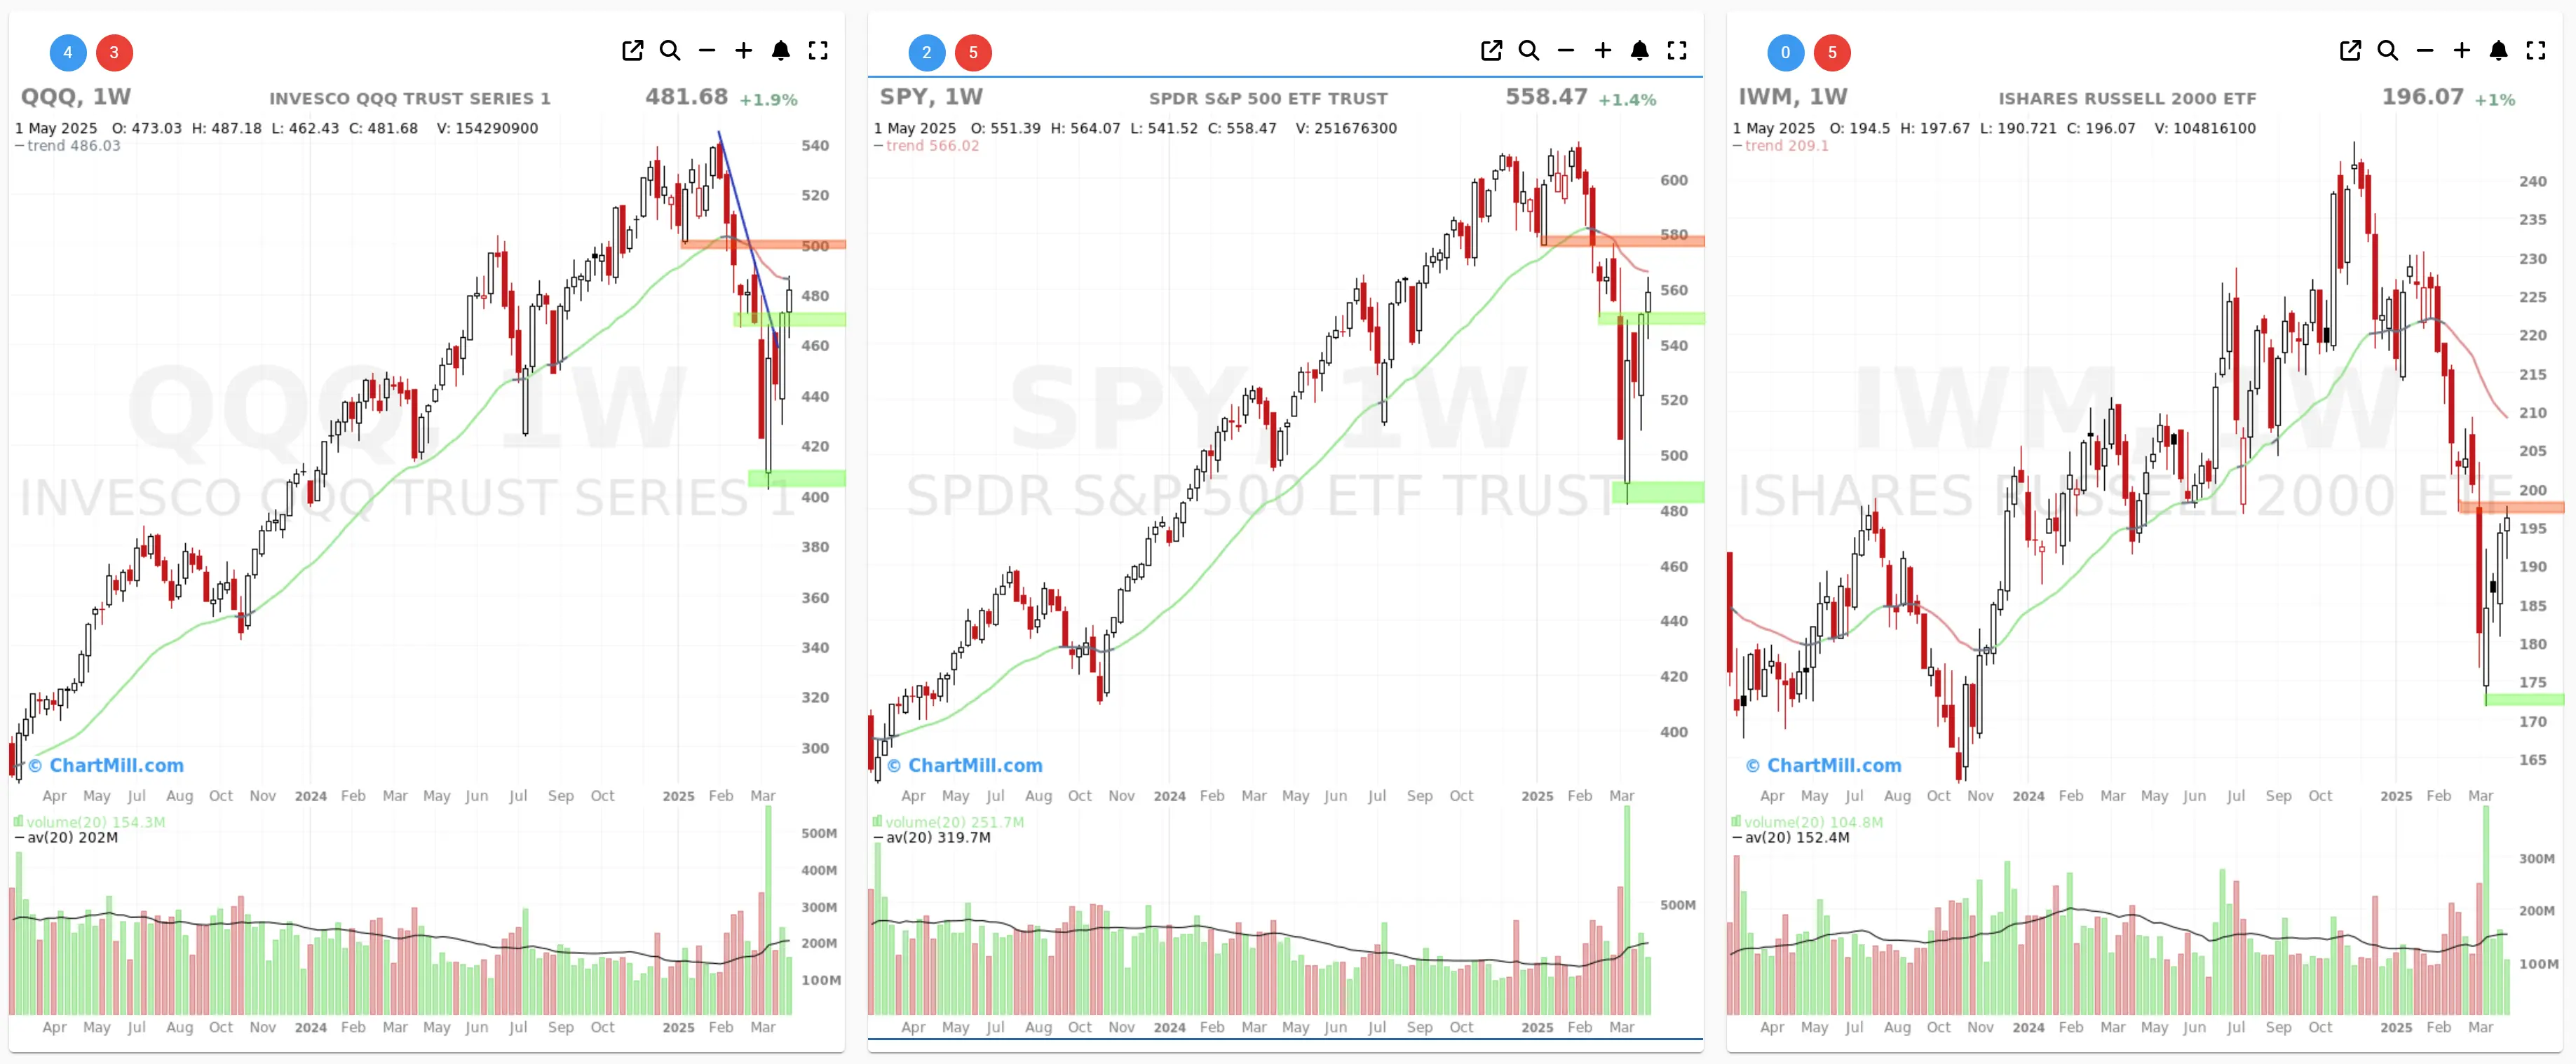
- Long-Term Trend: Down (no change)
- Long-Term Trend: Neutral (from negative)
- Long-Term Trend: Down (no change)
Market Breadth Analysis for May 1, 2025 (After Market Close)
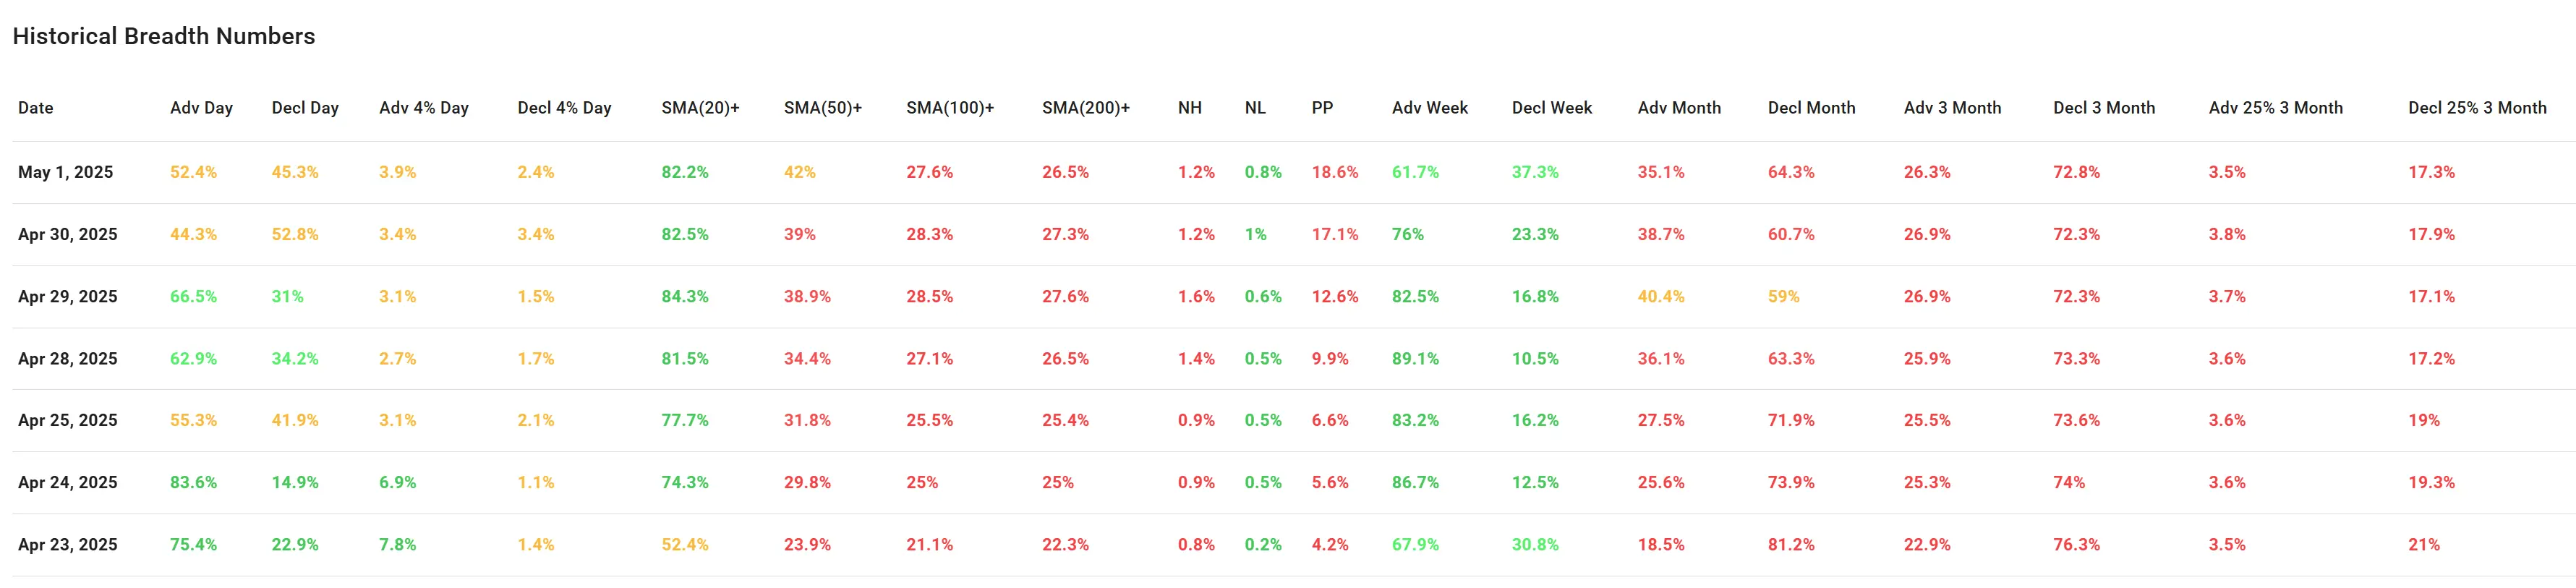
The market breadth data from the past week suggests a mixed to slightly improving underlying market structure, though with fading momentum compared to the sharp bullish readings seen in late April.
1. Advancing vs. Declining Stocks
-
May 1, 2025: 52.4% of stocks advanced while 45.3% declined — a slight edge to the bulls, but far from decisive.
-
This contrasts with April 24, where a strong 83.6% of stocks advanced, indicating a much broader and more enthusiastic buying participation back then.
-
Since April 29 (66.5% advancing), the percentage of advancing stocks has been tapering off.
Interpretation: Momentum has softened compared to the high participation mid-to-late April. The most recent day still leans bullish, but barely.
2. Percentage of Stocks Above Key Moving Averages
-
SMA(20): Remains strong at 82.2% on May 1 — a sign of short-term bullish strength still intact.
-
SMA(50), SMA(100), SMA(200): All hovering between 26.5%–42%, showing weak medium- to long-term participation.
-
SMA(200)+: 26.5%
-
SMA(100)+: 27.6%
-
SMA(50)+: 42%
Interpretation: Short-term momentum is clearly positive, but longer-term breadth remains fragile, raising questions about the sustainability of the rally.
3. 4% Movers (High Volatility Breadth)
-
Advancers 4% Day: Only 3.9% of stocks gained 4% or more on May 1.
-
Decliners 4% Day: 2.4% dropped 4%+.
-
These figures have stayed relatively low over the last several sessions.
Interpretation: There is not much force behind price moves, implying limited conviction. This is not typical of a strong breakout environment.
4. New Highs (NH) vs. New Lows (NL)
-
NH: 1.2% | NL: 0.8% (May 1)
-
These numbers have barely budged over the last week.
Interpretation: The market is not producing a high number of fresh breakouts, even during up sessions. Suggests a narrow leadership.
5. Participation over Longer Timeframes
-
Advancers over 3 months: Stable around 26–26.3% this past week.
-
Decliners over 3 months: Consistently high at 72–76%, barely improving despite recent gains.
-
Adv 25% 3 Month: Only 3.5%–3.8% of stocks are up more than 25% over three months.
Interpretation: Broad-based momentum is still lacking. Even with the recent rally, most stocks are still in a medium-term downtrend.
6. Weekly and Monthly Breadth
-
Adv Week (past week ending May 1): 61.7%, a decline from peak values like 89.1% on April 28.
-
Adv Month: Dropped to 35.1% from a recent peak of 40.4% on April 29.
-
Decl Month: Still high at 64.3%.
Interpretation: Weekly breadth is softening, and monthly data still shows the majority of stocks are in a downtrend.
Final Summary
While short-term breadth metrics like SMA(20)+ remain strong, medium- to long-term market participation is weak, and the rally is losing breadth and momentum. Very few stocks are achieving significant gains, new highs remain rare, and declining stocks over a 3-month window still dominate.
This divergence signals caution: unless participation broadens across more timeframes and more stocks break above longer-term moving averages, the recent bounce risks turning into just another bear market rally rather than a sustainable uptrend
823.62
+29.52 (+3.72%)
311.96
-1.68 (-0.54%)
435.28
+9.88 (+2.32%)
114.5
+2.89 (+2.59%)
287.21
+6.69 (+2.38%)
45.3
+0.25 (+0.55%)
597.02
+24.81 (+4.34%)
Find more stocks in the Stock Screener
LLY Latest News and Analysis
 3 days ago - ChartmillWhich S&P500 stocks are moving before the opening bell on Friday?
Before the opening bell on Friday, let's take a glimpse of the US markets and explore the S&P500 top gainers and losers in today's pre-market session.
 3 days ago - ChartmillMarket Monitor May 2 ( Microsoft, Meta UP - Eli Lilly DOWN)
Wall Street Rebounds as Microsoft and Meta Impress, Eyes Turn to Jobs Report and Tariff Tensions
 4 days ago - ChartmillExplore the top gainers and losers within the S&P500 index in today's session.
Stay informed about the performance of the S&P500 index one hour before the close of the markets on Thursday. Uncover the top gainers and losers in today's session for valuable insights.
 4 days ago - ChartmillWhich S&P500 stocks have an unusual volume on Thursday?
Let's have a look at what is happening on the US markets on Thursday. Below you can find the S&P500 stocks with an unusual volume in today's session.
4 days ago - ChartmillWhat's going on in today's session: S&P500 moversJoin us in exploring the top gainers and losers within the S&P500 index in the middle of the day on Thursday as we examine the latest happenings in today's session.
 4 days ago - ChartmillThursday's session: gap up and gap down stock in the S&P500 index
Stay tuned for the market movements in the S&P500 index on Thursday. Check out the gap up and gap down stocks in the S&P500 index during today's session.
4 days ago - ChartmillThese S&P500 stocks are moving in today's pre-market sessionPre-market stock analysis of S&P500 stocks on 2025-05-01: top gainers and losers in today's session.
 17 days ago - ChartmillMarket Monitor April 18 ( Netflix UP, DOWN)
Wall Street Mostly Lower Amid Trump-Fed Tensions, Nvidia’s Continued Slide
18 days ago - ChartmillStay informed with the top movers within the S&P500 index on Thursday.Stay updated with the movement of S&P500 stocks in today's session. Discover which S&P500 stocks are making waves on Thursday.
18 days ago - ChartmillWhich S&P500 stocks have an unusual volume on Thursday?Let's have a look at what is happening on the US markets on Thursday. Below you can find the S&P500 stocks with an unusual volume in today's session.
18 days ago - ChartmillWhat's going on in today's session: S&P500 moversStay updated with the movement of S&P500 stocks in today's session. Discover which S&P500 stocks are making waves on Thursday.
18 days ago - ChartmillThere are notable gap-ups and gap-downs in today's session.The session on Thursday is off to an intriguing start with several stocks showing significant price gaps. Let's examine the gap up and gap down stocks in today's session.
