The market finally took a small breath after last week’s sharp run, but the internal data did not break.
Index Overview (SPY, QQQ, IWM)
Short Term (Daily)

Long Term (Weekly)
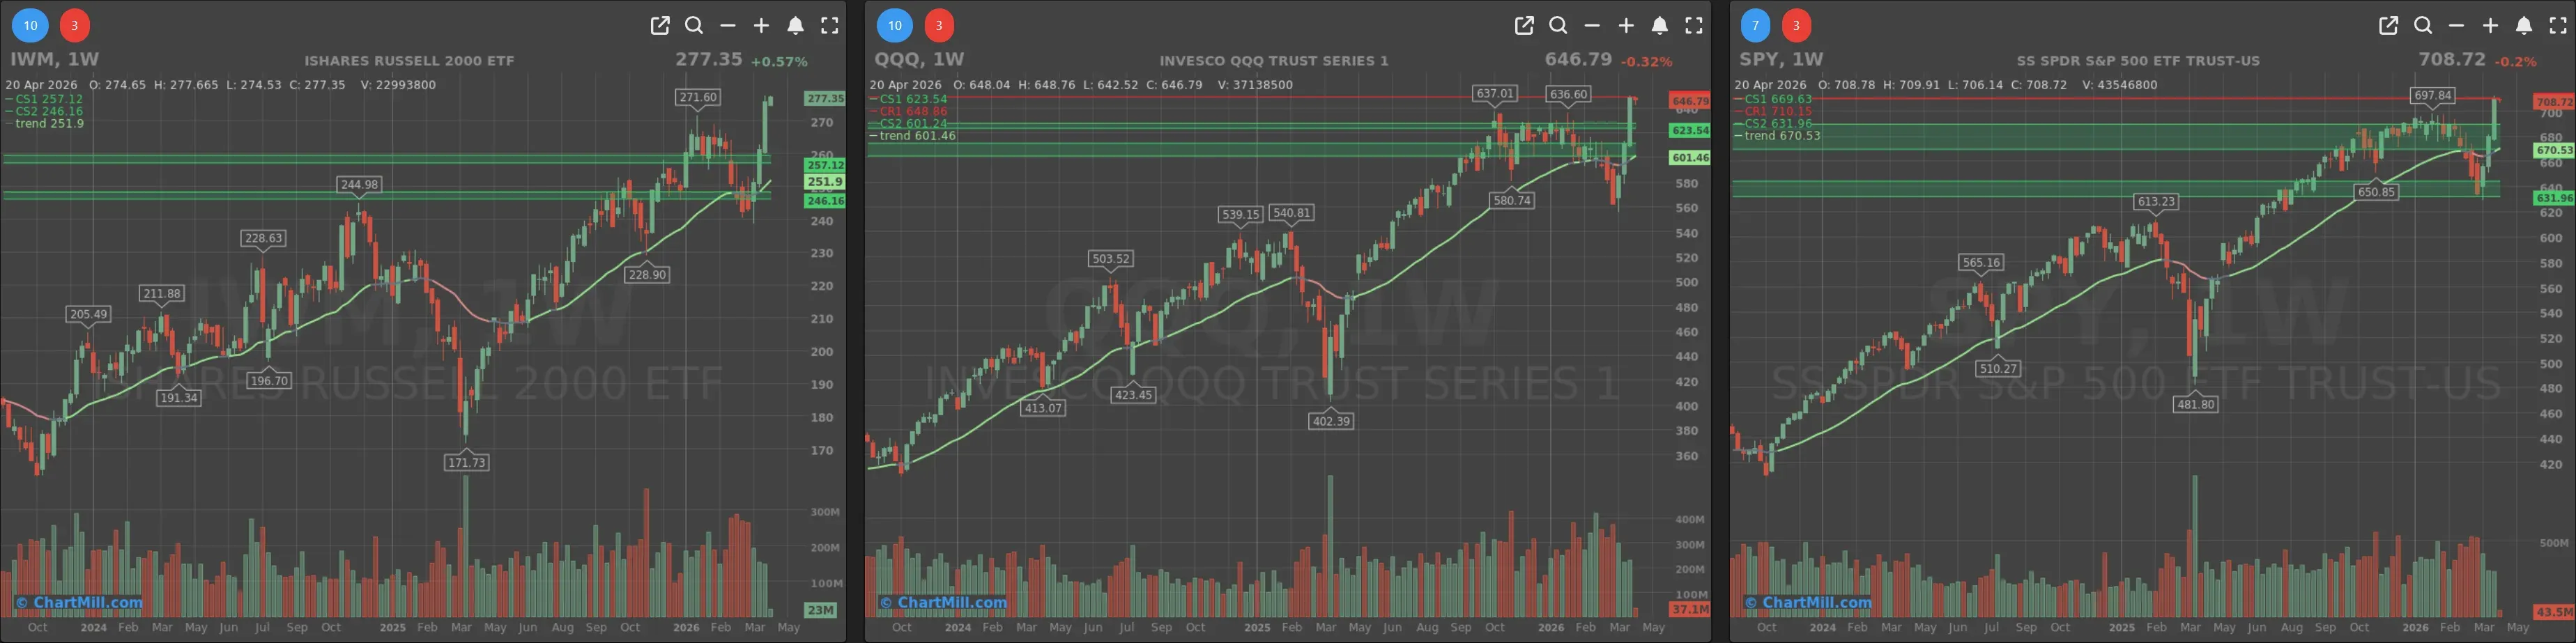
SPY paused just below overhead resistance after its recent rebound leg. The daily chart still looks constructive: price remains above both the 9-day and 21-day EMA, and the short-term trend is still up. On the weekly chart, the long-term trend remains positive, the ChartMill Trend Indicator just turned positive also.
QQQ showed the same basic pattern, but with a slightly weaker finish than SPY. After a very strong rebound, the ETF ran into resistance and pulled back modestly. That fits with the idea that leadership-heavy growth names needed a rest after an extended streak. Importantly, the daily trend structure remains intact and the ChartMill Trend Indicator switched from Neutral to Positive.
IWM was the standout. While SPY and QQQ cooled off, small caps pushed higher again and closed at fresh recovery highs on the daily chart. It suggests participation is not collapsing beneath the surface, but broadening out. On the weekly chart, IWM remains in a positive long-term trend.
Breadth Analysis
Compared with the previous trading day, the message did not change much, but the tone softened.
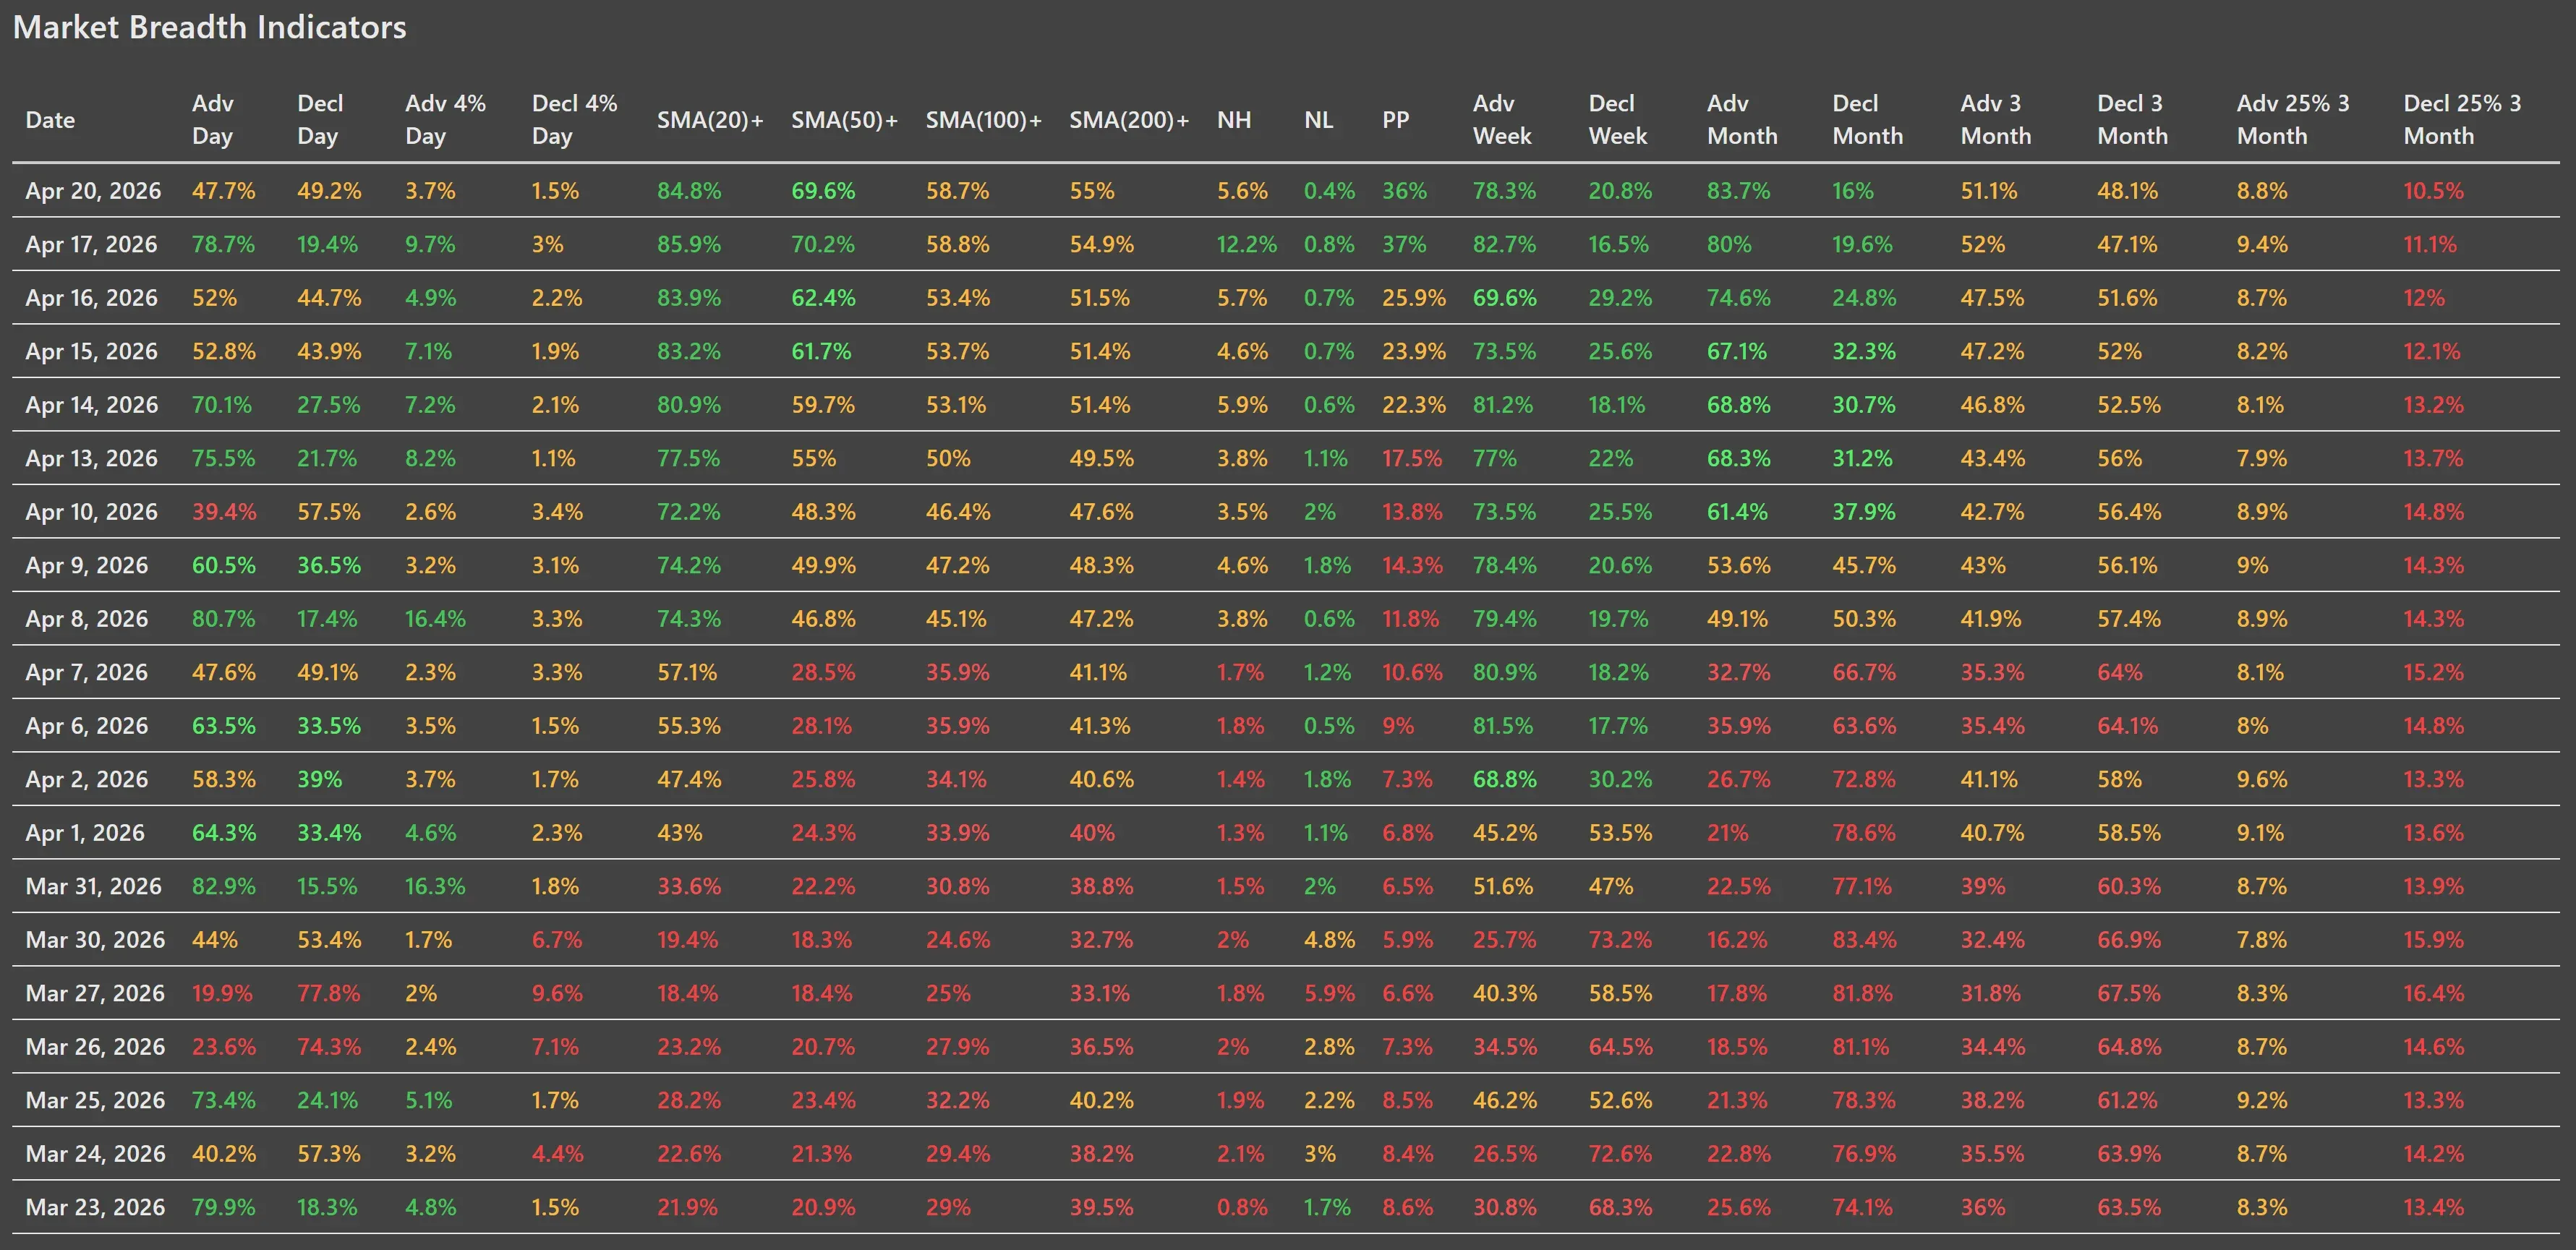
Daily advancers and decliners were nearly balanced at 47.7% vs 49.2%, a clear step down from Friday’s strong upside breadth. That said, there was no real washout underneath the surface. The market simply lost momentum after several strong sessions.
The stronger part of the table remains the trend participation data. 84.8% of stocks are above their 20-day moving average, 69.6% above the 50-day, 58.7% above the 100-day, and 55.0% above the 200-day. Those numbers are still strong in absolute terms, even if they slipped marginally from the prior session. This is what a constructive pause usually looks like: short-term thrust cools off, but the broader participation backdrop remains healthy.
New highs versus new lows also stayed supportive. 5.6% of stocks posted new highs, while just 0.4% made new lows. That is not breakout-level leadership, but it is far from defensive behavior. The 36% bullish point-and-figure reading also held near recent highs. In other words, the internal repair that started earlier this month is still in place.
The multi-day data remains even more convincing. Weekly breadth stayed strong at 78.3% advancers versus 20.8% decliners, while monthly breadth remains firmly positive at 83.7% advancers versus 16.0% decliners. Even the 3-month figures, which had been badly damaged during the prior correction phase, continue to improve gradually.
This is consistent with the recent pattern from earlier breadth reports: the short-term rebound may no longer be accelerating every day, but the medium-term internal trend is still healing.
Context and interpretation
The market news backdrop helps explain why breadth cooled without actually breaking.
Monday’s session saw a modest pullback in the major indices while oil surged sharply on renewed Iran uncertainty and the looming ceasefire deadline, which likely limited risk appetite during the day. That fits the softer daily breadth numbers. But the absence of a real expansion in new lows or a deeper deterioration in moving-average participation suggests the market handled that macro pressure relatively well. Apple’s CEO transition announcement came after the bell, so it belongs to the next session’s narrative, not this breadth snapshot.
Conclusion
This was not a high-energy breadth session, but it was still a constructive one. The market paused after a strong run, daily breadth cooled, and the major large-cap ETFs ran into resistance. None of that is unusual. The more important point is that the broader internal data remains positive and small caps are now contributing in a more meaningful way.
As long as the moving-average participation figures stay elevated and new lows remain subdued, the current pullback in daily momentum looks like digestion.
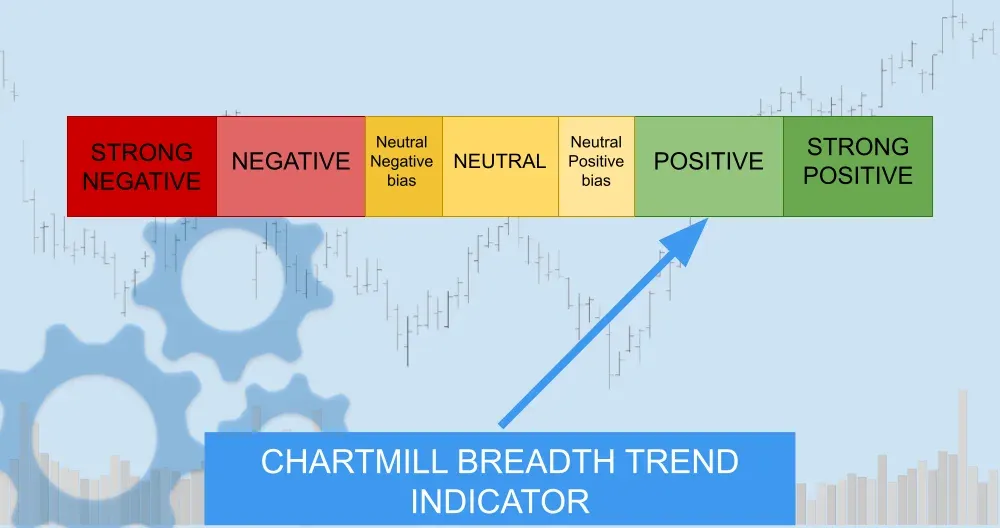
Breadth trend rating: 6/7 — Positive
ChartMill Market Desk
This daily Market Breadth Report is prepared by ChartMill for informational purposes only and does not constitute investment advice. Always do your own due diligence before making investment decisions.
Next to read: After Fifteen Years, Tim Cook Steps Down, Wall Street Steps Back, Oil Steps Up