Friday’s session was not just another up day. The major indexes broke to fresh highs together, while breadth expanded sharply beneath the surface. The tape is now clearly positive.
Index Overview (SPY, QQQ, IWM)
Short Term (Daily)

Long Term (Weekly)
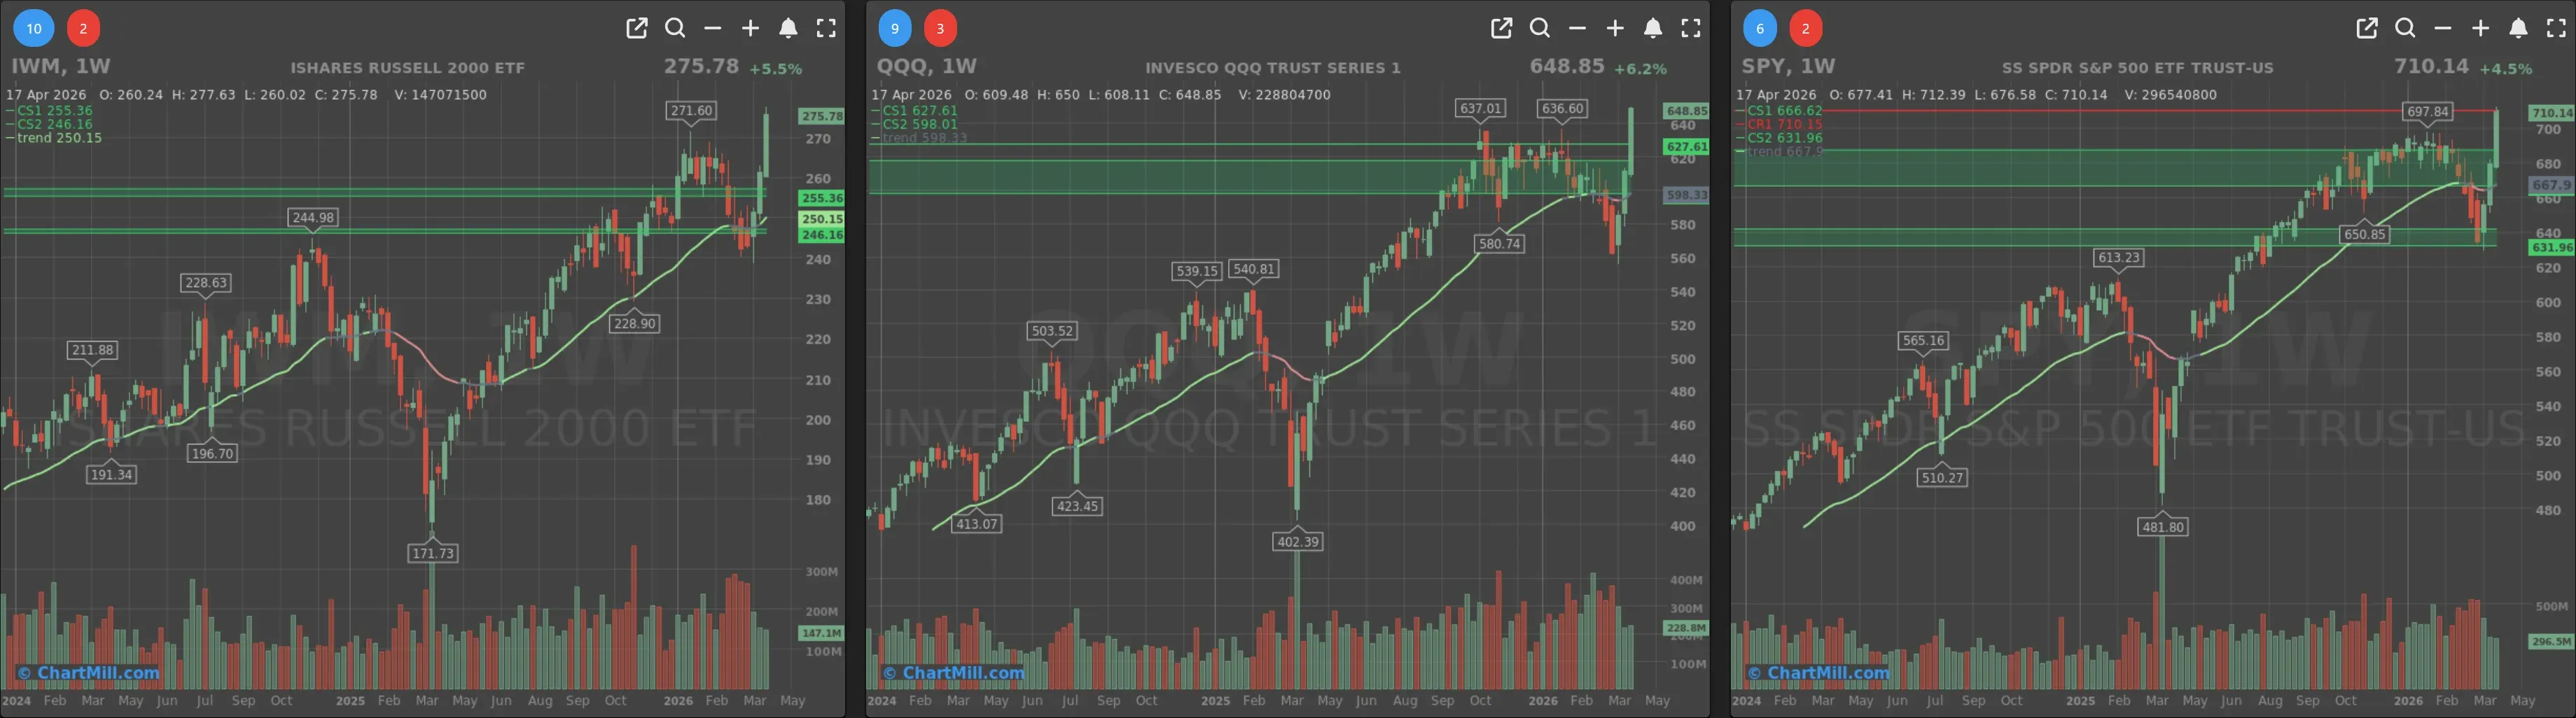
SPY closed at a fresh high and did so decisively. On the daily chart, price extended cleanly above the prior resistance zone near $698, well above both the 9EMA and 21EMA. Thursday already hinted that the rebound was holding together; Friday confirmed that buyers were still willing to press after the initial recovery phase instead of pausing right below old highs. On the weekly chart, SPY also pushed through the prior high area.
QQQ followed the same script, but with even more leadership quality. It cleared the prior ceiling around the $636-637 area and finished at another new closing high. The daily chart shows strong momentum and very little hesitation near the breakout level.
IWM was the standout on a relative basis, up 2.2% on the day and breaking above its prior swing high near $271.6. Small caps had already improved notably during the previous sessions, but Friday delivered the clearest proof yet that participation is broadening beyond mega caps and large-cap tech. The weekly chart also remains in a positive long-term trend. It does strengthen the case that this rally is becoming healthier internally.
Breadth Data: Strong, Stable, and Still Improving
Friday’s breadth numbers were strong enough to move this from “healthy rebound” to “clear internal confirmation.”
 3
3
Advancers beat decliners by 78.7% to 19.4% on the day. That is a clear breadth thrust, and it came one day after a much more balanced session on Thursday. In other words, the market did not merely hold gains after Thursday’s constructive action, it accelerated again.
The moving-average participation data also improved further:
- 85.9% of stocks are now above their 20-day SMA
- 70.2% are above their 50-day SMA
- 58.8% are above their 100-day SMA
- 54.9% are above their 200-day SMA
Short-term participation is already very strong, medium-term participation is now solidly positive, and the longer-term measures have climbed back above the 50% line. Compared with Thursday, this is another step higher across the board, not a stall.
New highs versus new lows also improved meaningfully. 12.2% of stocks printed new highs, while just 0.8% printed new lows. That is one of the cleaner signs in the table. When indexes are breaking out and new lows stay muted, the move carries more credibility.
The percentage of stocks in bullish price patterns rose to 37%, up sharply from 25.9% the previous day. That is another sign that leadership is broadening and that more charts are repairing into constructive setups rather than simply bouncing off oversold levels.
Short-, medium-, and longer-term read
The 1-week and 1-month breadth data are now clearly strong:
- Advancing week: 82.7%
- Declining week: 16.5%
- Advancing month: 80%
- Declining month: 19.6%
That is a strong expansion in participation, especially when combined with the breakout action in SPY, QQQ, and IWM.
The 3-month data is better, but still more mixed than the short-term view. Advancing stocks over three months rose to 52%, versus 47.1% declining. That is an improvement, but not yet the kind of decisive separation you would expect in a fully mature broad bull run.
The same caution applies to the 25% movers over three months. Stocks up 25% or more sit at 9.4%, while stocks down 25% or more remain at 11.1%. That is better than where things stood during the March weakness, but it tells us there is still longer-term repair happening beneath the surface. This is one reason not to overstate the current strength.
Link with the previous trading day
Compared with Thursday, the main message is continuation with confirmation.
Thursday already suggested that the market was holding its recent gains well. Friday added two things that were still missing: a stronger breadth thrust and more convincing breakouts in all three major index ETFs. So the story did not change, but it did strengthen.
What also stands out is that the improvement is becoming more balanced. Earlier in the rebound, the recovery leaned more heavily on large caps and growth. Friday’s strong move in IWM makes the tape look more complete. That does not erase all underlying fragility, but it does reduce one of the more obvious concerns from earlier in the month.
News and market context
The market news backdrop helps explain the risk-on tone, especially the rotation away from energy and into more growth- and fuel-sensitive parts of the market. The key point, though, is timing: Friday’s bullish breadth can reasonably be linked to the optimism that followed Iran’s “Strait of Hormuz fully open” message and the sharp drop in crude during that session, but not to the weekend reversal, because that came after Friday’s close.
Friday’s breadth strength reflects what the market knew and priced during Friday’s session: falling oil, risk appetite, and another extension in the Nasdaq-led advance. The later reversal is relevant for Monday’s open, not for explaining Friday’s internal data.
The broader context from the news report also fits what the charts were already showing: the Nasdaq100 extended its winning streak to thirteen sessions, while Friday’s move also brought record highs for the S&P 500 and Nasdaq. That matches the strong breakout character visible in SPY and QQQ here.
Breadth trend rating
Rating: 6/7 — Positive
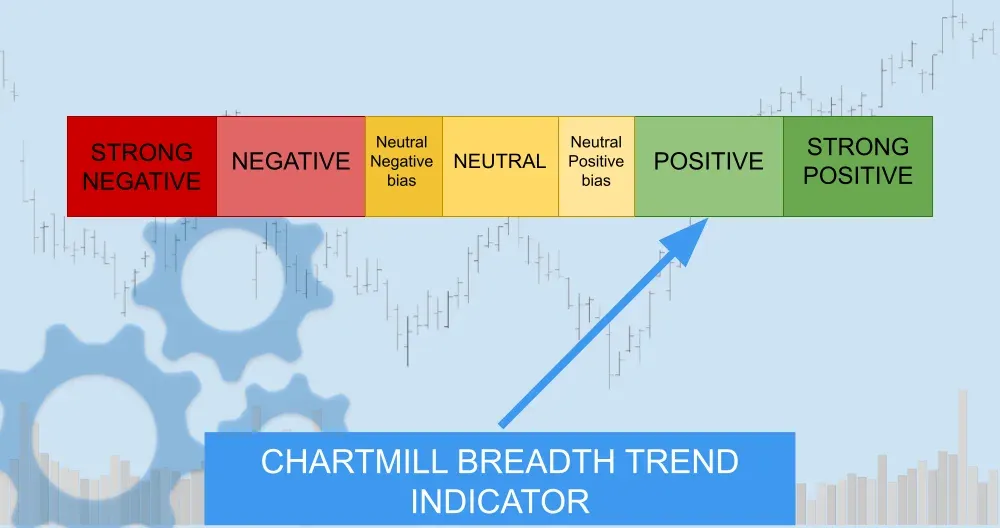
The breakout in the indexes is now backed by strong daily and weekly breadth, improving moving-average participation, expanding new highs, and better small-cap confirmation.
I am not moving it to 7/7 very positive yet, because the longer-term participation data still shows some unfinished repair. The 3-month numbers have improved, but they are not yet overwhelmingly strong, and the 25%-mover data still reflects lingering internal damage from the prior correction.
Bottom line
Friday delivered a meaningful confirmation day. The market did not just continue higher; it broadened out while doing so. SPY and QQQ broke cleanly to new highs, IWM joined with authority, and the breadth table showed a real expansion in participation.
That keeps the market in a positive state. The main thing to watch next is whether this breakout starts attracting sustained follow-through across the longer-term participation data as well. If that happens, the case for an eventual move from positive to very positive becomes much stronger.
ChartMill Market Desk
This daily Market Breadth Report is prepared by ChartMill for informational purposes only and does not constitute investment advice. Always do your own due diligence before making investment decisions.
Next to read: The Nasdaq's 13-Day Run Meets Iran's Weekend Reversal