For investors using a technical breakout method, the aim is to find stocks that are solid from a trend viewpoint and are currently in a tight price pattern, ready for their next upward move. This method relies on two main proprietary measures from ChartMill: the Technical Rating, which measures the general condition and trend force of a stock, and the Setup Quality Rating, which evaluates the state of its present price formation. A strong result in both shows a stock is not only in a good uptrend but is also gathering force for a possible breakout, giving a more distinct entry point with set risk.
ALPHABET INC-CL C (NASDAQ:GOOG) is now a leading example using this method, receiving high marks with a Technical Rating of 9 and a Setup Quality Rating of 9. This pairing indicates the tech company is showing both very good fundamental force and a favorable price formation for traders watching momentum and breakouts.
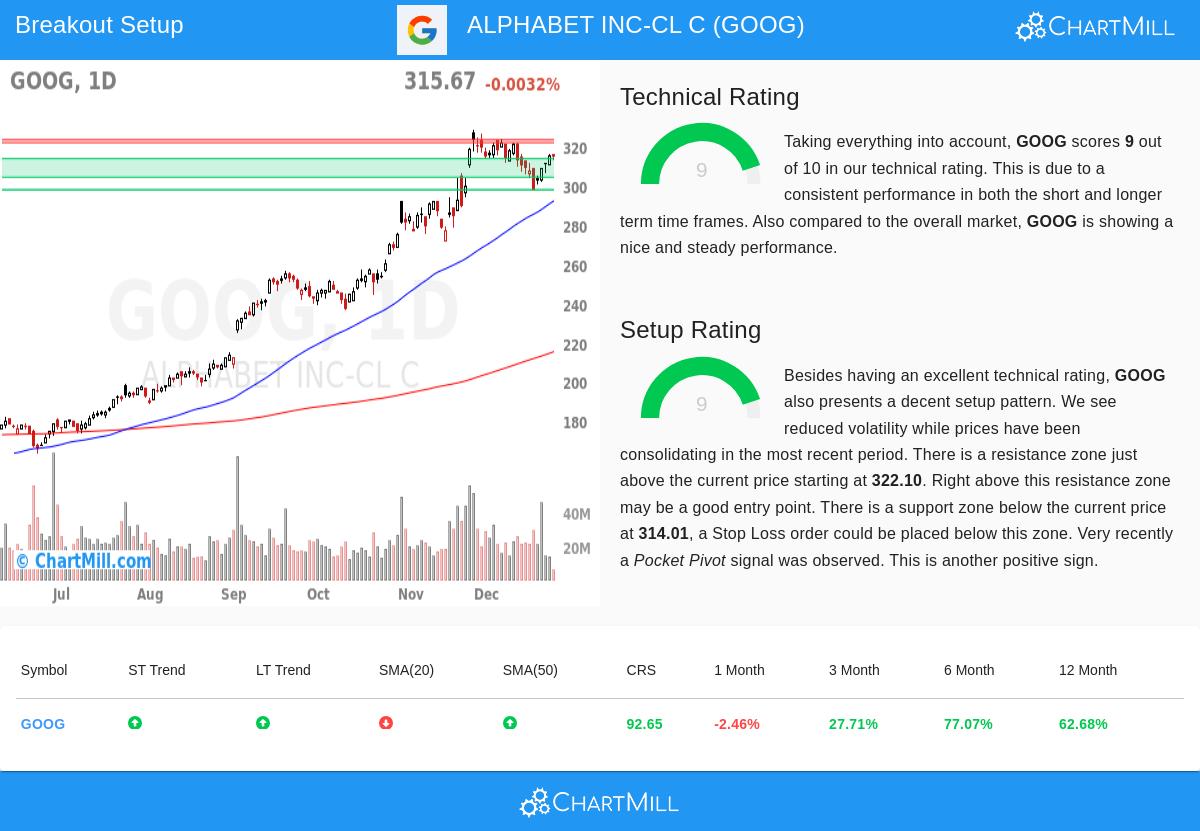
Technical Force: A Base of Momentum
The base of any breakout trade is a stock already in a clear, continuing uptrend. A high Technical Rating shows this, and Alphabet’s score of 9 shows wide force across many time periods and measures. According to the detailed technical report, the company's chart is performing well across most areas.
- Trend Agreement: Both the near-term and longer-term trends for GOOG are seen as positive. This agreement across different periods is a strong sign of steady buying interest and lowers the chance of a quick trend change.
- Relative Performance: The stock is doing better than 92% of the whole market over a one-year period and is in the high group of its Interactive Media & Services sector, doing better than 91% of similar companies. This better relative performance is a mark of sector leadership.
- Moving Average Backing: The stock is priced above all its important simple moving averages (SMA20, SMA50, SMA100, SMA200), and the longer-term averages (SMA50, SMA100, SMA200) are all moving up. This layered arrangement of support levels is a standard feature of a sound upward trend.
- Nearness to Highs: GOOG is trading close to its 52-week high, which often shows an absence of supply from investors wanting to sell at a no-gain price. While the wider S&P 500 is also near highs, Alphabet’s performance stays aligned with the leading market indicator.
This solid technical picture answers the first important question for a breakout trader: "Is this a stock I want to own?" The high Technical Rating confirms that GOOG is a technically sound stock with momentum present, making it a fitting choice for more formation study.
Setup Quality: The Tightening Before the Move
A strong trend by itself is not a reason to buy, entering during a steep rise often results in buying at a top. The Setup Quality Rating deals with the timing question: "When should I enter?" A high score here shows the stock is in a forming phase, trading in a fairly narrow band with lowering price swings, which frequently comes before a clear move.
Alphabet’s Setup Rating of 9 points to a good forming pattern developing within its set uptrend. The technical report mentions several main points:
- Formation and Swings: The analysis says the stock is showing "lowered price swings while prices have been forming in the latest period." This tightening behavior suggests a standoff between buyers and sellers, gathering force for the next directional move.
- Set Support and Resistance: The setup finds clear, close levels for risk control. There is a support area below the present price, grouped around $304.50 to $314.01, made by a mix of moving averages and trendlines. Just above, a resistance area sits between $322.10 and $323.65.
- Pocket Pivot Signal: A recent "Pocket Pivot" signal was seen, which is a volume-based sign pointing to institutional buying during the formation. This can be an early sign of a breakout.
- Automated Trade Idea: Based on this pattern, the report details a possible breakout plan. It proposes an entry point just above the resistance area at about $323.66, with a stop-loss order set below the support area near $304.49. This makes a set, measurable risk for the trade.
This high-grade setup is key because it gives a logical entry method (a buy-stop order above resistance) and a clear exit point if the breakout does not work (a stop-loss below support), letting traders take part in the next possible upward phase while carefully controlling risk.
Conclusion and Next Actions
For technical investors looking for breakout chances, ALPHABET INC-CL C presents a strong case. It joins the forceful, sector-leading momentum shown by a Technical Rating of 9 with the controlled, low-swing formation of a Setup Quality Rating of 9. This double force indicates the stock has both the basic force for a continued move and is now making a pattern that gives a planned entry point.
It is key to recall that technical patterns show likelihoods, not guarantees. Any trade should be viewed within the frame of total portfolio risk control, and investors should always know of coming company events, like earnings reports, that could affect price movement.
Find more possible breakout setups each day by using the Technical Breakout Setups screen.
Disclaimer: This article is for information only and is not financial advice, a suggestion, or an offer or request to buy or sell any securities. The study is based on technical signs and past data, which are not promises of future results. Investing has risk, including the possible loss of principal. Always do your own study and think about your financial position and risk comfort before making any investment choices.