
Technical analysis often relies on identifying stocks that are not only in strong uptrends but also consolidating in a way that suggests an imminent breakout. This approach combines trend strength with pattern quality to pinpoint potential entry opportunities. One method for identifying such setups involves using proprietary ratings that evaluate both the technical health of a stock and the quality of its current trading pattern. These metrics help investors focus on securities that are both fundamentally strong from a momentum perspective and positioned for a potential near-term move.
AMAZON.COM INC (NASDAQ:AMZN) currently stands out based on this methodology, displaying a solid technical profile alongside a promising consolidation pattern. The stock’s technical rating of 9 out of 10 indicates very good underlying strength, supported by a long-term positive trend and superior relative performance, beating 81% of all stocks over the past year. This high rating reflects factors such as sustained price strength, favorable moving average alignment, and consistent momentum, all of which are critical for identifying leaders in an upward-trending market. A strong technical rating like this suggests the stock is in a healthy uptrend, making it a candidate for continuation rather than reversal.
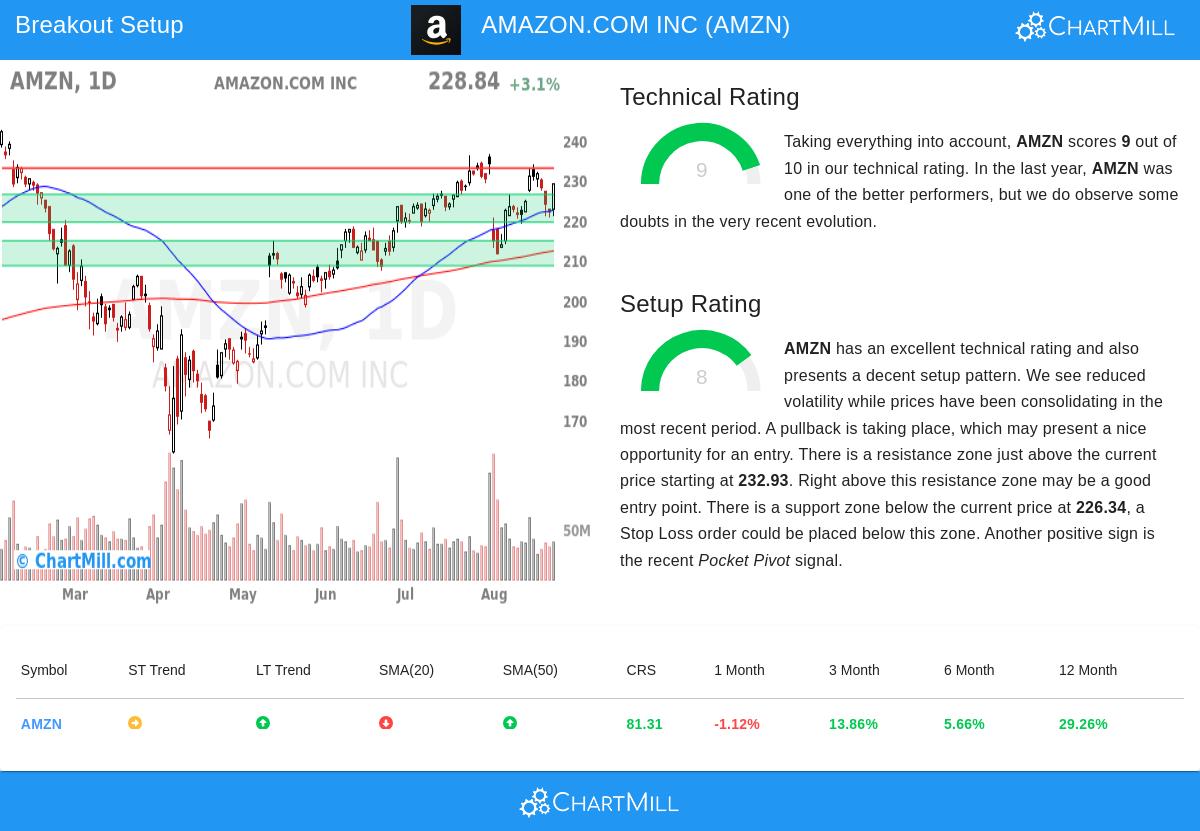
Complementing its technical strength, Amazon also shows a setup rating of 8, signaling a high-quality consolidation pattern. The stock has been trading within a defined range between approximately $211 and $237 over the past month, with recent price action near the middle of this band and decreased volatility. This kind of basing behavior often precedes breakouts, as it indicates equilibrium between buying and selling pressure before a potential directional move. The setup rating incorporates proximity to moving averages, the presence of support and resistance levels, and recent indicators such as a pocket pivot, a bullish volume-price signal observed here. These factors are essential because they help identify lower-risk entry points; a good setup implies that a breakout level is clear and that a protective stop-loss can be logically placed just below nearby support, in this case around $226.
Further reinforcing the setup, the technical report highlights a key resistance level at $232.93, which serves as a potential trigger point for entry. A move above this level could signal the resumption of the upward trend, while solid support zones provide a logical exit point near $219, helping to manage risk. The combination of high technical and setup ratings makes AMZN particularly interesting for technical investors seeking breakout opportunities in a market where the S&P 500 is also trending positively in both the short and long term.
For investors interested in exploring more breakout setups like Amazon, the Technical Breakout Setups screen is updated daily with fresh candidates that meet similar criteria of high technical and setup ratings.
Disclaimer: This article is for informational purposes only and does not constitute investment advice. Investing in stocks involves risk, including the possible loss of principal. Always conduct your own research and consider your financial situation before making investment decisions.