AMAZON.COM INC (NASDAQ:AMZN) - A Strong Growth Stock with a Technical Breakout Pattern
By Mill Chart
Last update: May 21, 2025
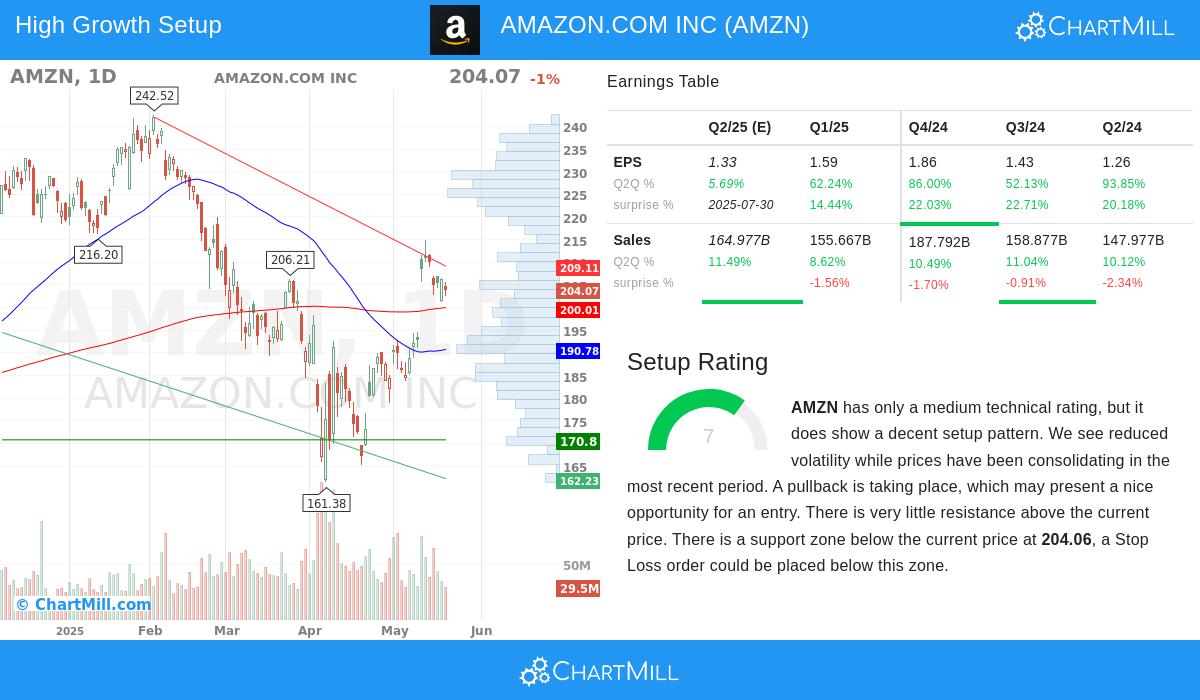
AMAZON.COM INC (NASDAQ:AMZN) was identified by our screener as a strong growth stock with a favorable technical setup. The company demonstrates solid growth fundamentals while presenting a potential breakout opportunity in its price action. Below, we examine why AMZN fits these criteria.
Growth Fundamentals
AMZN’s fundamental analysis highlights several strengths:
- Strong Earnings Growth: Over the past year, EPS grew by 71.99%, with a 5-year average annual growth of 36.89%.
- Revenue Expansion: Revenue increased by 10.08% in the last year and has grown at an average of 17.86% annually.
- Profitability: The company scores 8/10 in profitability, with strong margins—10.14% net profit margin and 11.02% operating margin.
- Future Growth Expectations: Analysts project EPS growth of 20.25% and revenue growth of 9.85% annually.
While AMZN’s valuation appears expensive (P/E of 33.24), its high growth and profitability justify the premium compared to peers.
Technical Setup
The technical analysis reveals a promising pattern:
- Bull Flag Formation: AMZN is currently showing a bull flag, a continuation pattern that often follows a strong upward move.
- Short-Term Uptrend: The stock’s short-term trend is positive, supported by rising 20-day and 50-day moving averages.
- Support Levels: Key support lies near $202.50, while resistance sits around $205.60. A breakout above resistance could signal further upside.
- Volume & Liquidity: With an average daily volume of 52.7M shares, AMZN remains highly liquid, reducing slippage risk.
Why This Combination Matters
Growth stocks with strong technical setups often present attractive entry points. AMZN’s fundamentals suggest sustained expansion, while the chart indicates a potential breakout. Investors looking for high-growth names with momentum may find this setup compelling.
For a deeper dive, review the full fundamental report and technical analysis.
Our Strong Growth Stocks with Good Technical Setup screener lists more stocks meeting these criteria.
Disclaimer
This is not investment advice. The observations are based on data available at the time of writing. Always conduct your own research before making investment decisions.
228.15
-1.8 (-0.78%)
Find more stocks in the Stock Screener
AMZN Latest News and Analysis