
Market Monitor May 5 ( Meta UP - Apple DOWN)
By Kristoff De Turck - reviewed by Aldwin Keppens
Last update: May 5, 2025

Wall Street Rebounds as Microsoft and Meta Impress, Eyes Turn to Jobs Report and Tariff Tensions
US markets surged for the ninth consecutive session on Friday, marking the longest winning streak since 2004. The Dow Jones Industrial Average advanced by 1.4%, while both the Nasdaq and S&P 500 gained 1.5%.
This rally helped recover losses caused by tariff announcements earlier this year, driven primarily by optimism surrounding US-China trade talks and strong employment data.
Jobs Report Beats Expectations
Investor confidence was boosted significantly by a stronger-than-expected US jobs report. In April, the US economy added 177,000 jobs, surpassing forecasts of around 138,000.
Unemployment held steady at 4.2%, and average hourly wages rose by 3.8% year-over-year. These positive employment numbers fueled hopes of sustained economic resilience.
Apple Faces Pressure from Tariffs
Despite the overall bullish sentiment, Apple (AAPL | -3.74%) shares fell nearly 4% following disappointing quarterly results. The company's sales in China unexpectedly contracted, and it warned of an additional $900 million cost in the upcoming quarter due to increased tariffs.
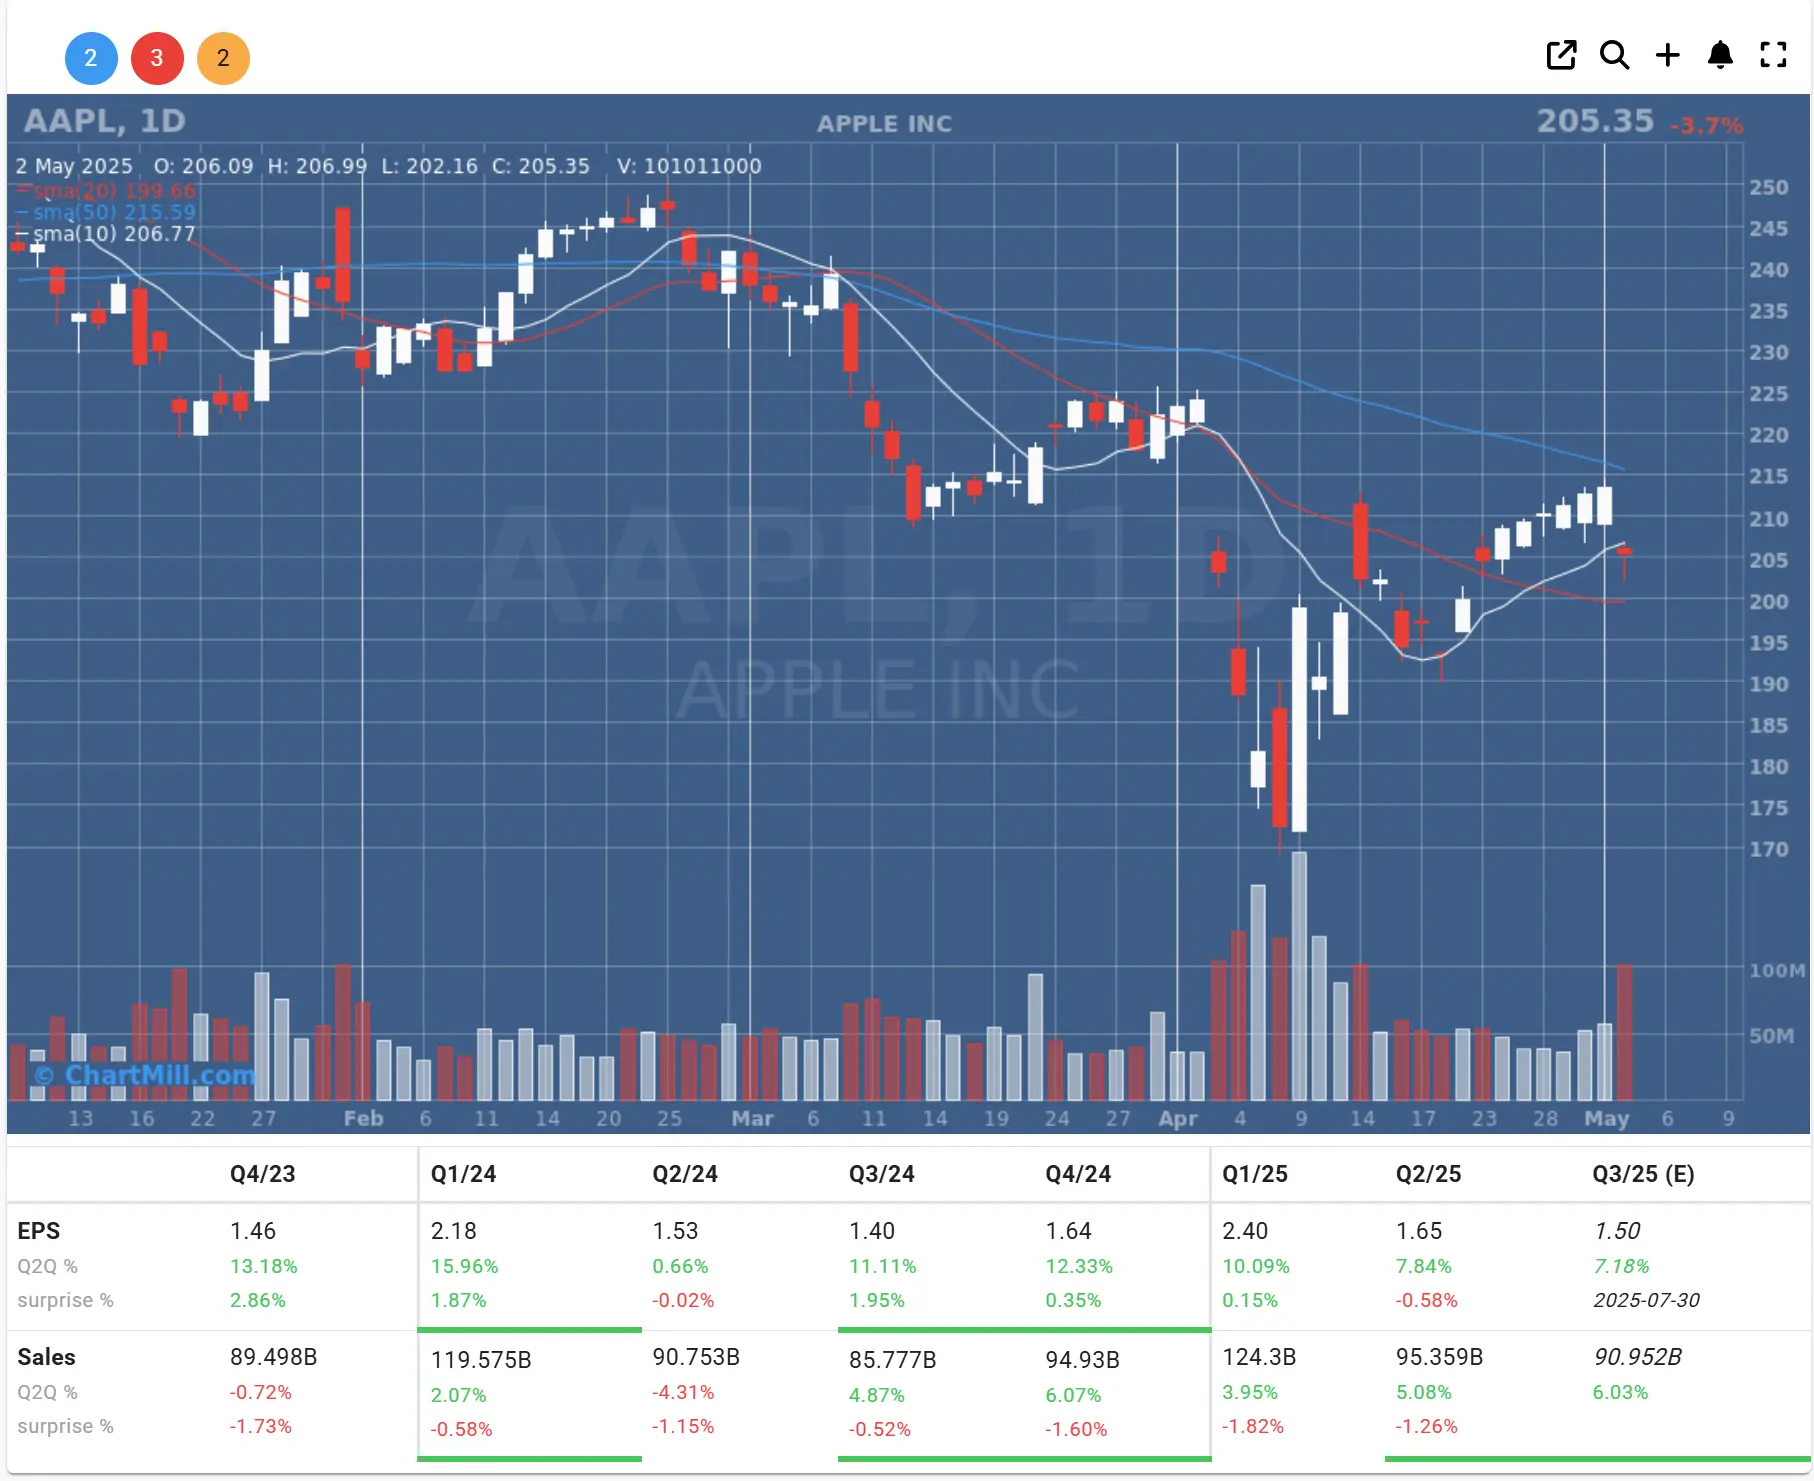
Apple FY 25 Second Quarter Results (press release)
Analysts, including those from Rosenblatt and Jefferies, downgraded Apple’s stock, citing increasing tariff-related risks.
Mixed Fortunes for Big Tech
Amazon’s (AMZN | -0.12%) shares fluctuated throughout the session after reporting mixed results; while quarterly earnings beat expectations, the outlook for operating profit disappointed investors. CEO Andy Jassy highlighted uncertainties tied to ongoing trade tensions, leaving Amazon shares nearly unchanged by the close.

Amazon financial results for its first quarter ended March 31, 2025 (press release)
In contrast, Microsoft (MSFT |+2.32%) and Meta (META | +4.34%) enjoyed substantial gains, buoyed by impressive earnings reports.
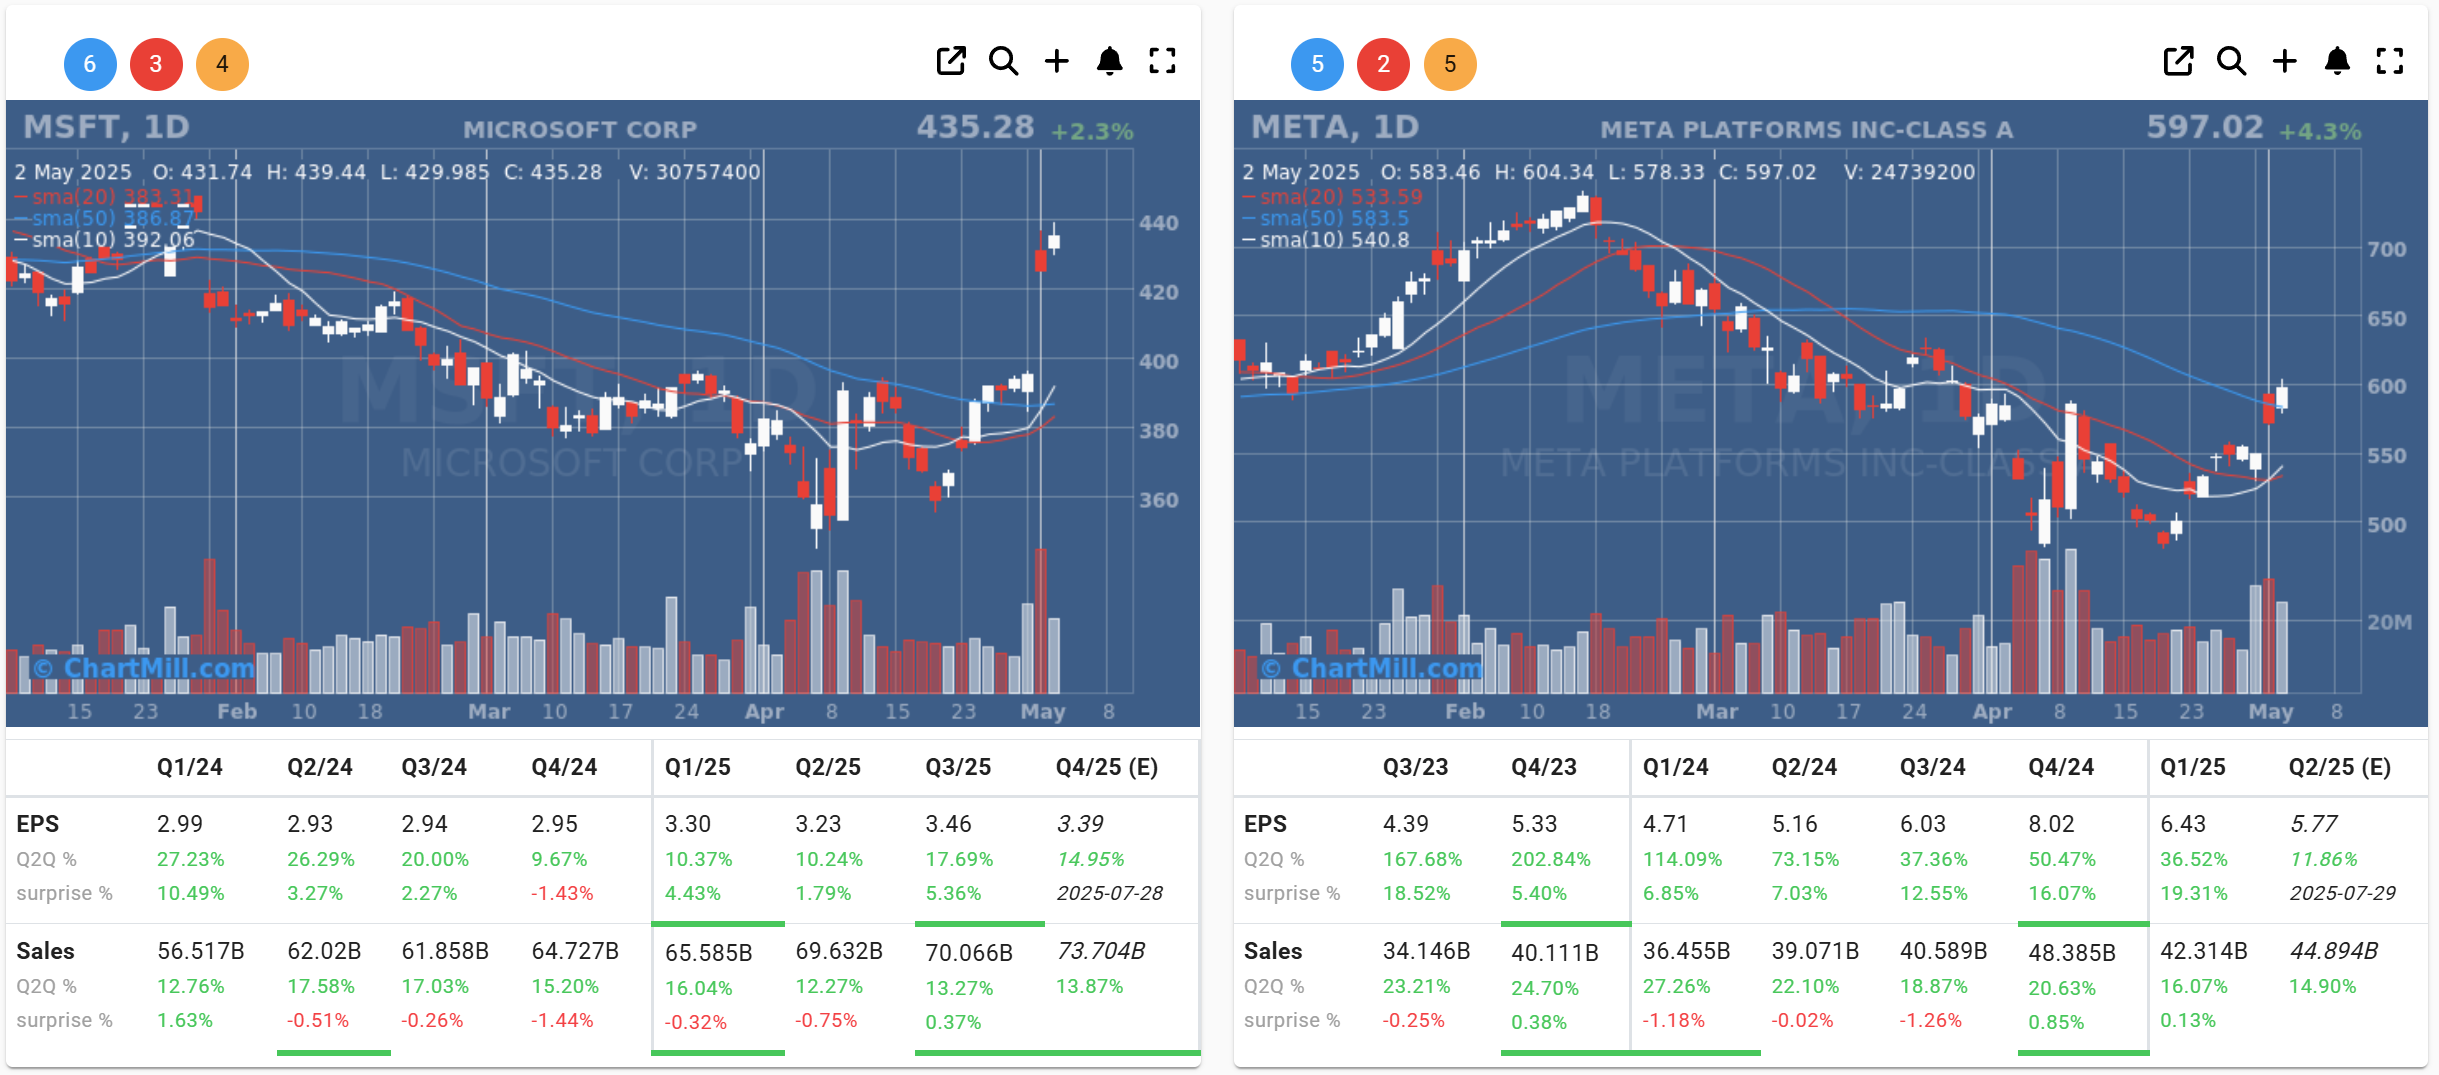
Microsoft results for the quarter ended March 31, 2025 (press release)
Meta financial results for the quarter ended March 31, 2025 (press release)
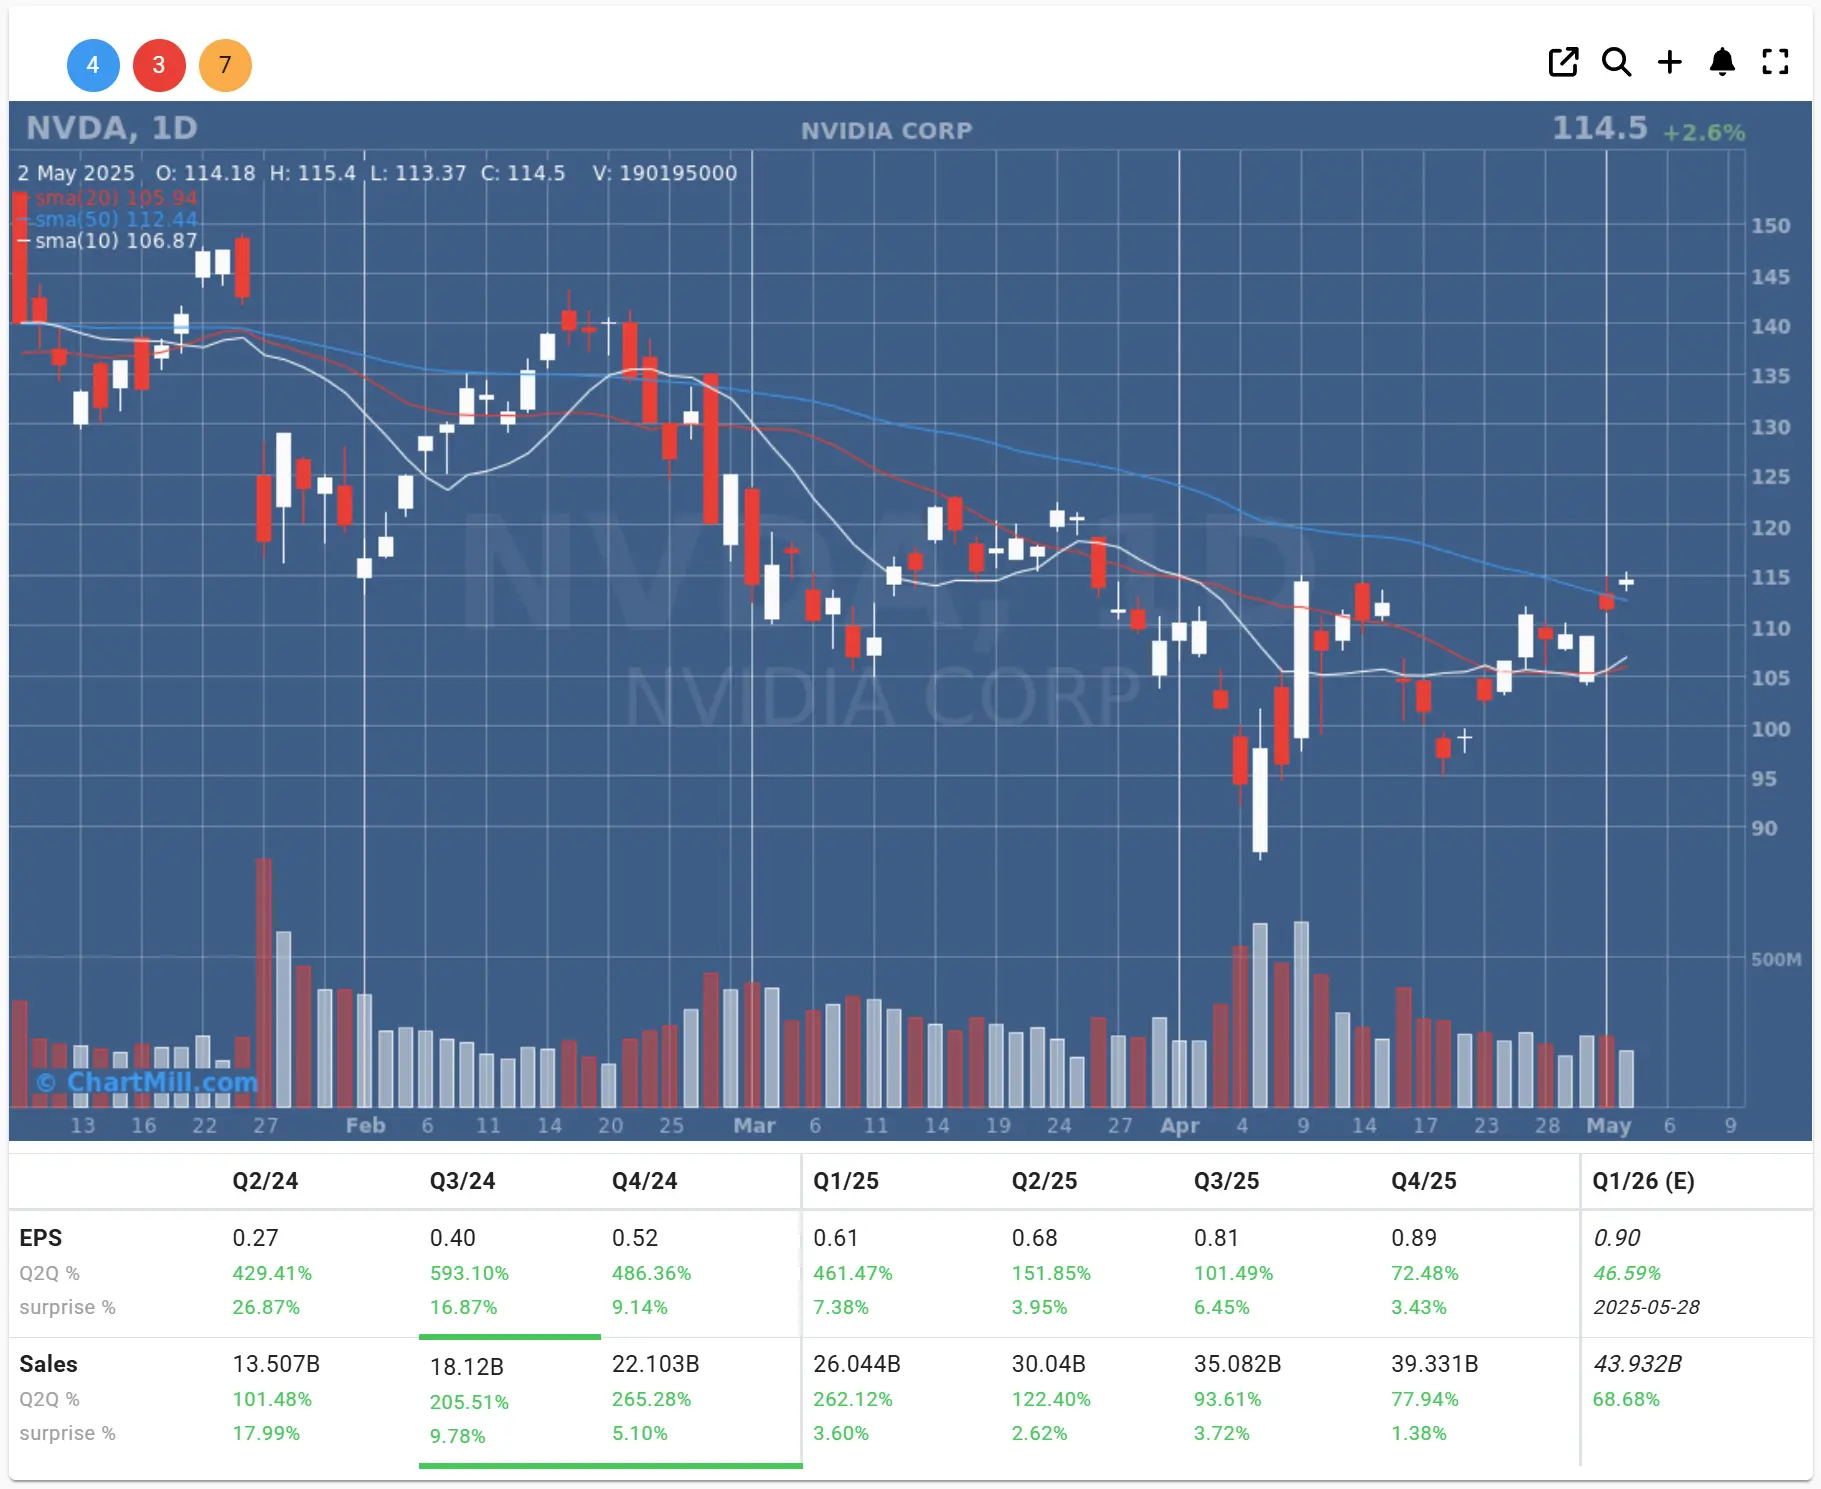
Nvidia (NVDA | +2.59%), eagerly awaited by investors, gained 2.5% ahead of its upcoming earnings release.
Warren Buffett Announces Retirement
A major highlight from the weekend was legendary investor Warren Buffett’s announcement that he will retire as CEO of Berkshire Hathaway at the end of this year, passing leadership to Greg Abel.
Buffett, 94, humorously acknowledged the transition at the company's annual shareholder meeting, emphasizing confidence in Abel, who has been with Berkshire for over two decades.
Looking Ahead
Next week, investors will closely monitor the Federal Reserve’s upcoming rate decision, especially following recent public pressure from former President Trump advocating for lower interest rates.
Daily Market Analysis – May 2, 2025 (After Market Close)
Short Term Trend
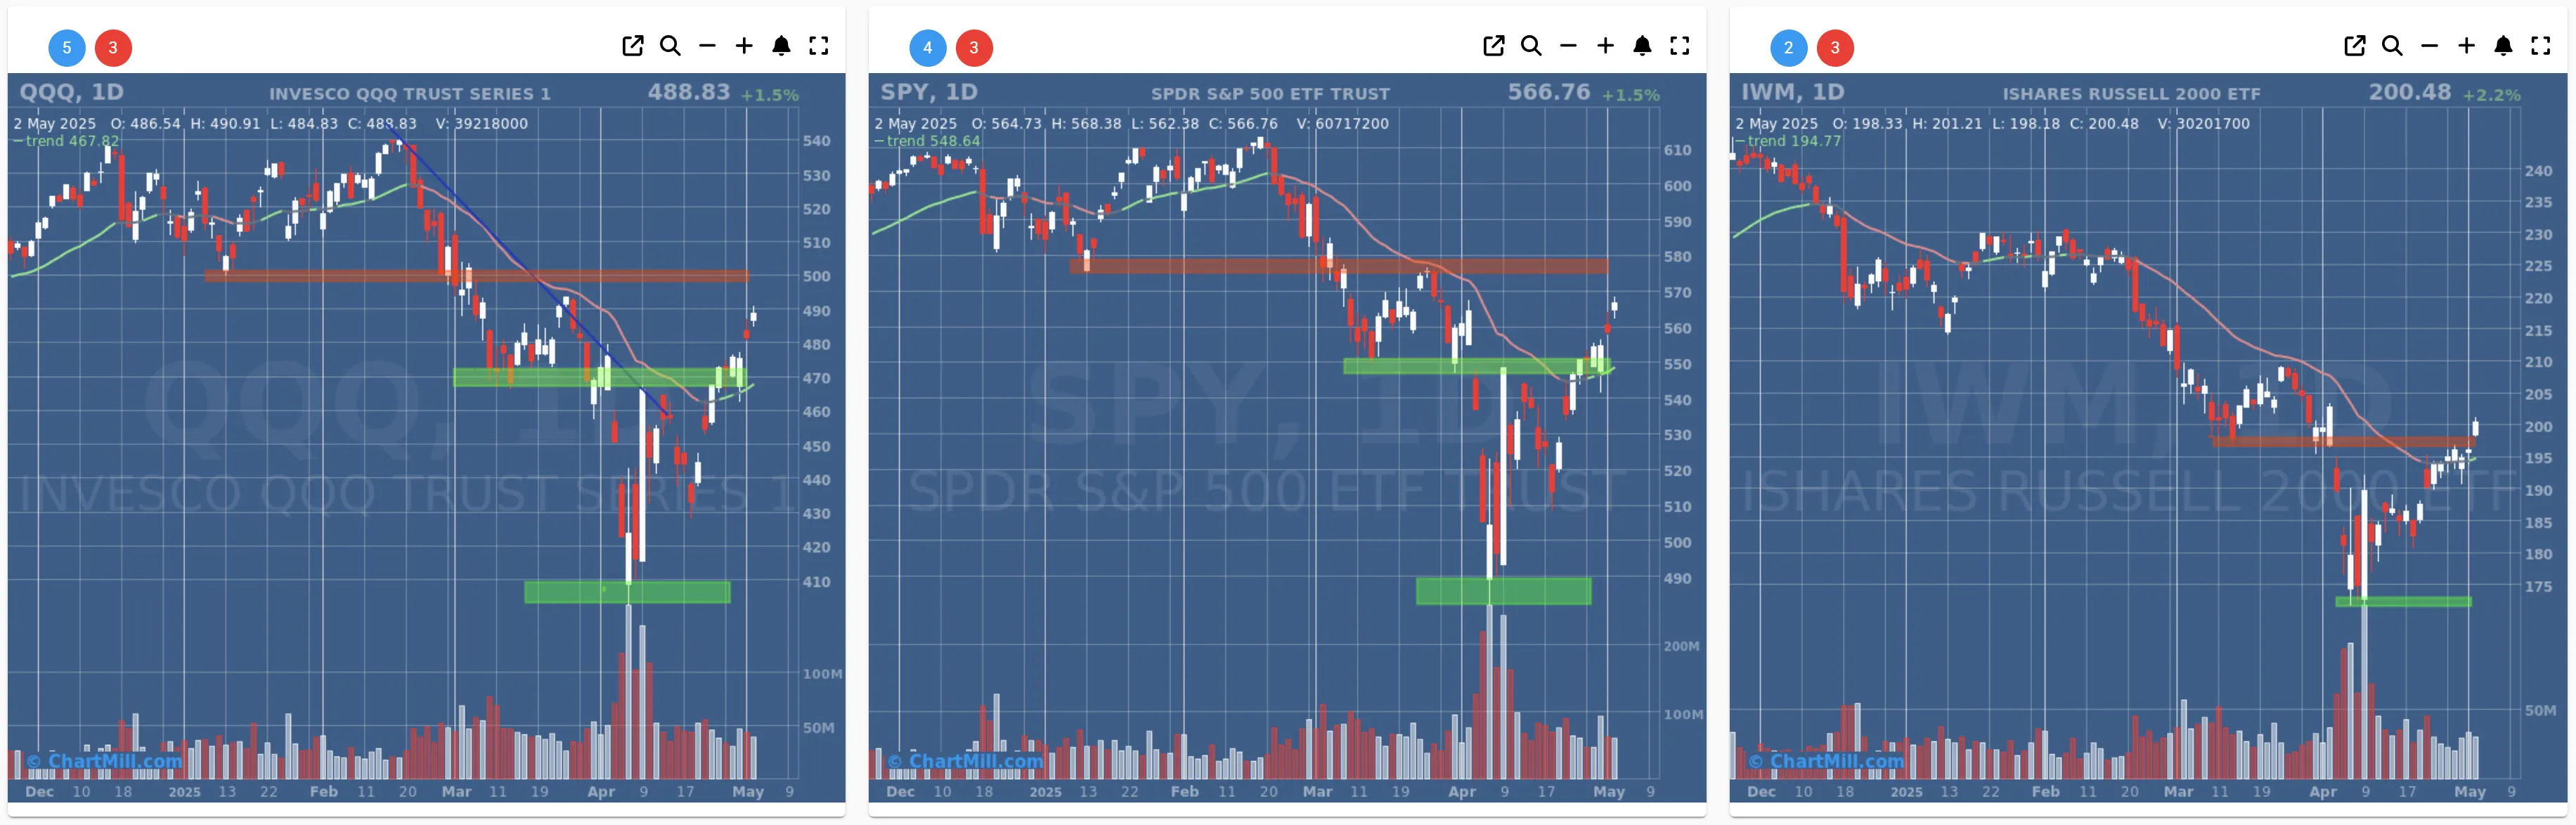
- Short-Term Trend: Bullish (no change)
- Support at $550
- Resistance at $580
- Volume: Below average (50)
- Pattern: Gap Up
- Short-Term Trend: Bullish (no change)
- Support at $470
- Resistance at $490
- Volume: Slightly below average (50)
- Pattern: Gap Up
- Short-Term Trend: Bullish from neutral)
- Support at $195
- Resistance at $210-215
- Volume: Slightly below average (50)
- Pattern: Gap Up
Long Term Trend
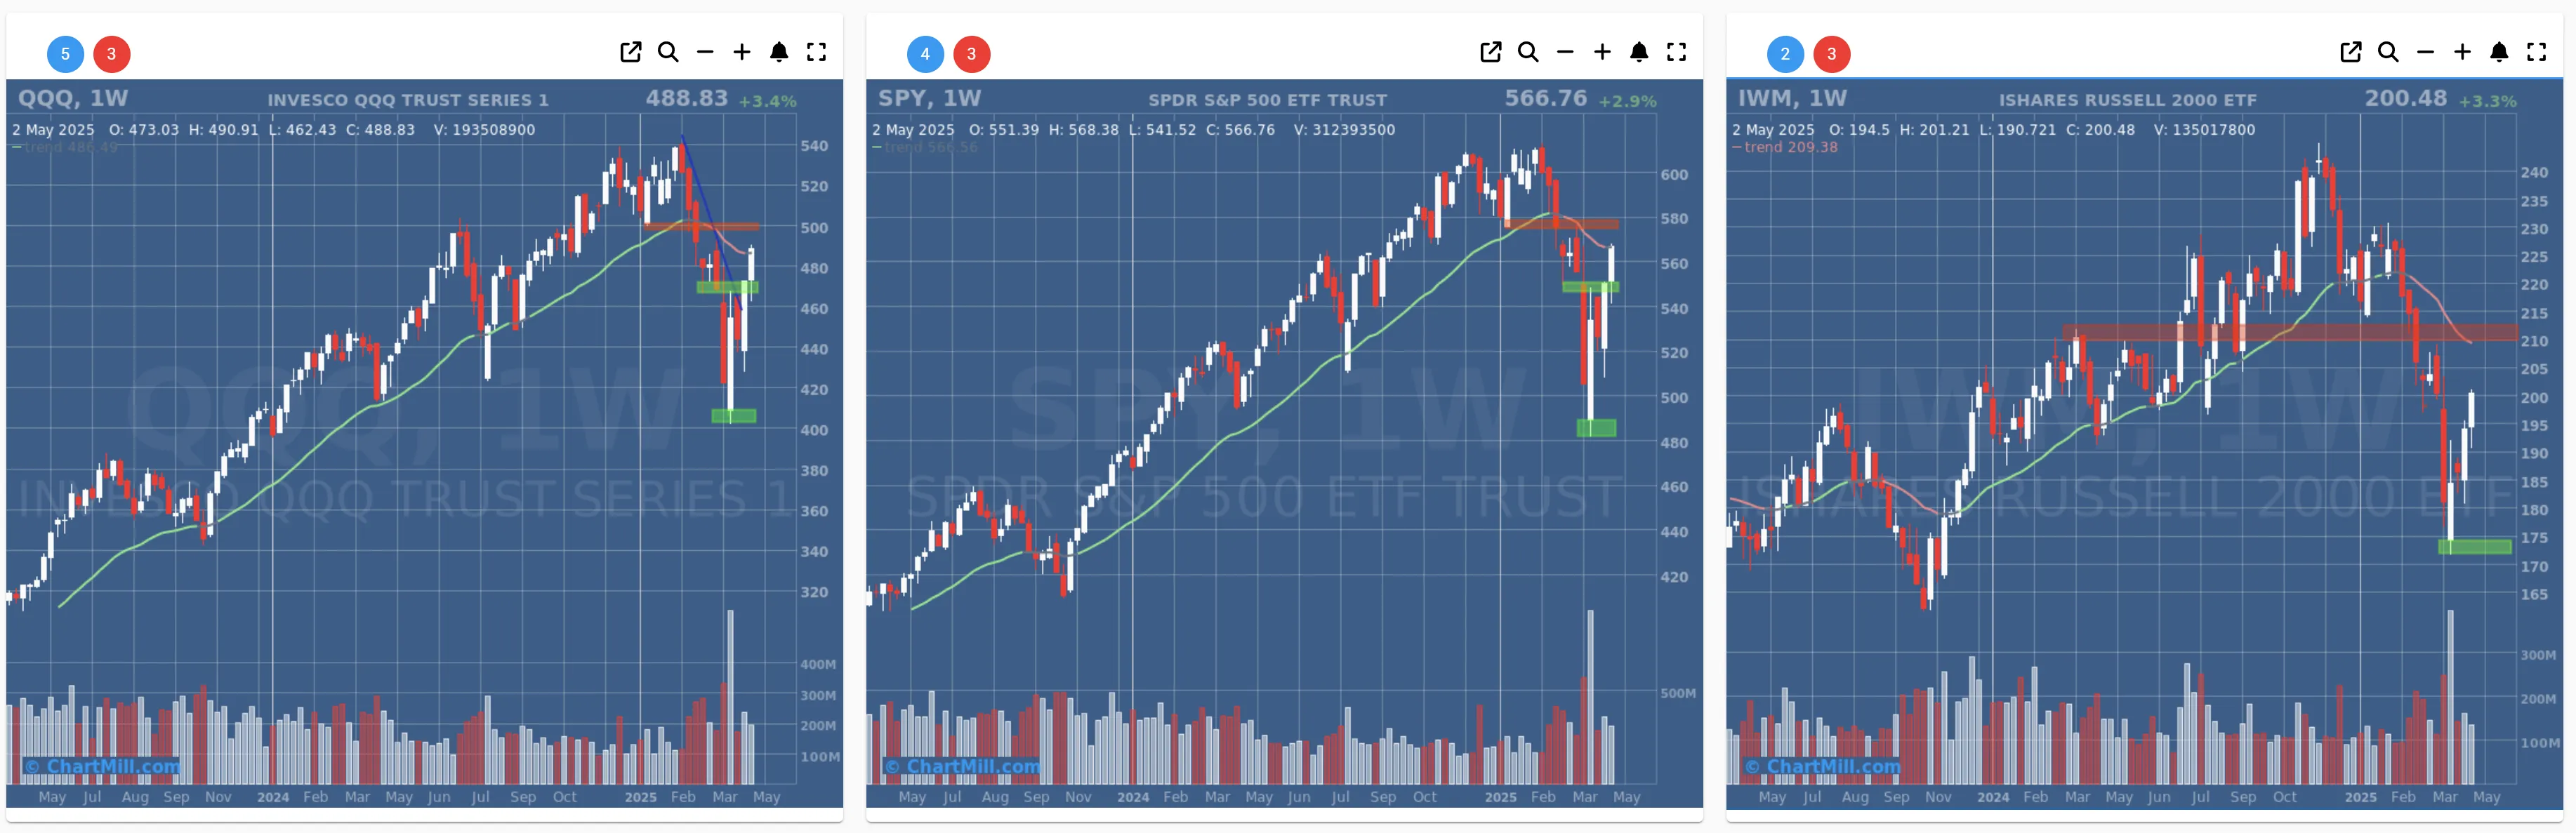
- Long-Term Trend: Neutral (from bearish)
- Long-Term Trend: Neutral (from bearish)
- Long-Term Trend: Down (no change)
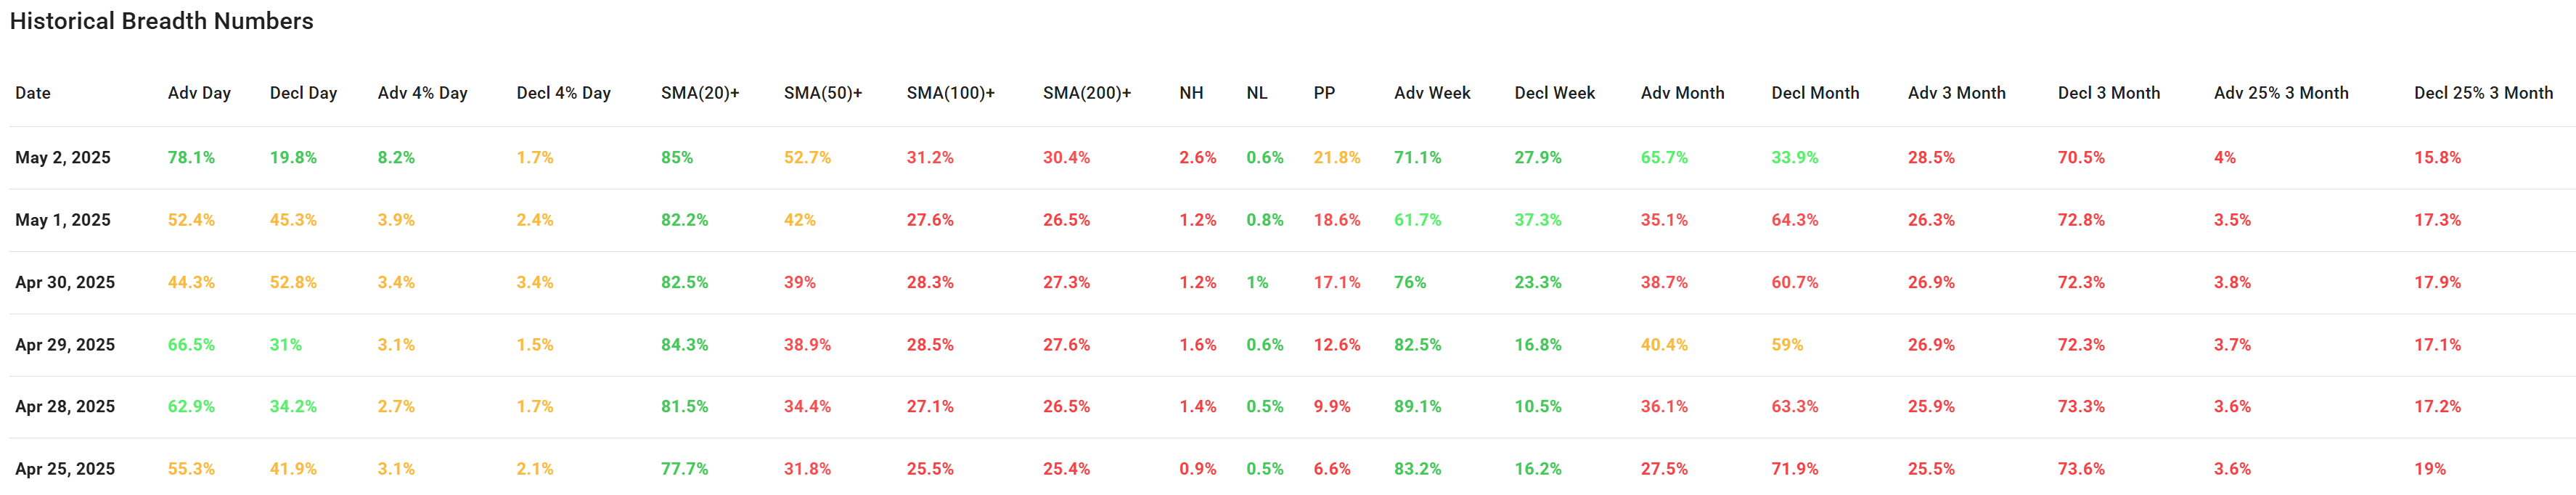
Market Breadth Analysis for May 2, 2025 (After Market Close)
1. Short-Term Breadth (Advancers vs. Decliners per Day)
-
May 2, 2025 stands out with 78.1% advancers vs. 19.8% decliners, the strongest bullish signal in this period.
-
Earlier in the week, May 1 showed a mixed breadth (52.4% advancers vs. 45.3% decliners), while April 30 was weak (44.3% advancers).
-
The market began turning bullish again starting April 29 (66.5% advancers) and April 28 (62.9% advancers).
➡ Conclusion: There is a clear shift toward bullish sentiment in the last 3 trading sessions.
2. Strong Movers (% Up/Down >4%)
-
May 2 had 8.2% of stocks rising more than 4%, the highest in the observed period, suggesting strong momentum.
-
The % of stocks falling >4% was consistently low, under 3.5%, showing limited downside thrust.
➡ Conclusion: Momentum is picking up on the upside with declining downside volatility.
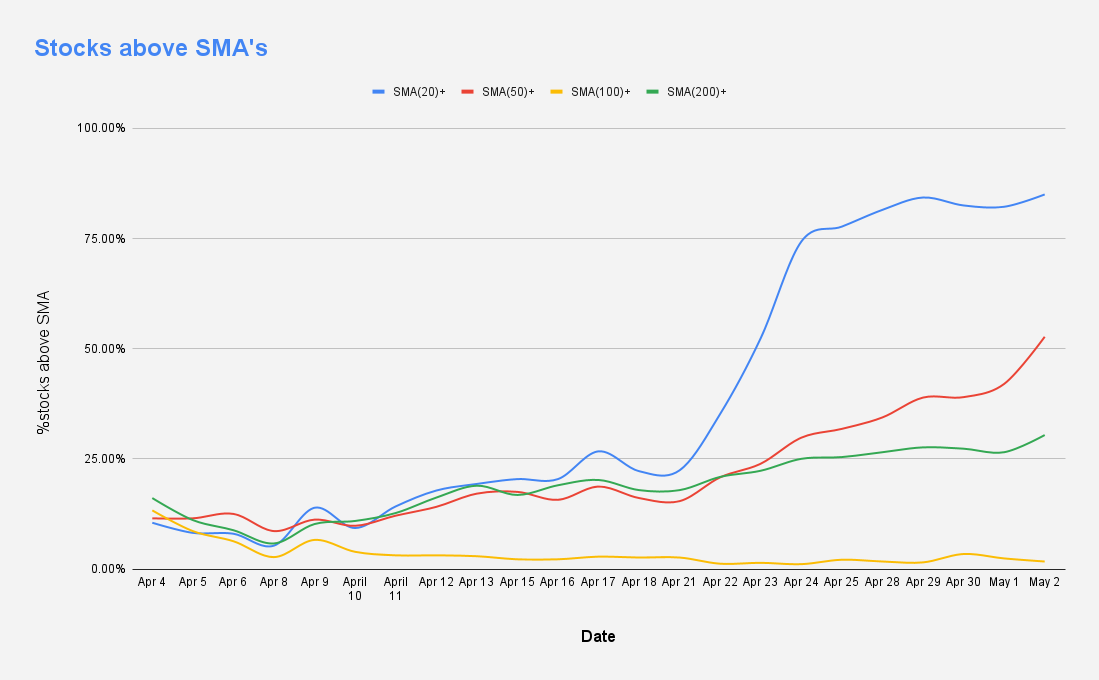
3. Moving Averages Participation (SMA breadth)
-
85% of stocks are above their 20-day SMA (very strong short-term breadth).
-
52.7% are above the 50-day SMA, a notable improvement over previous days (up from 31.8% on April 25).
-
100/200 SMA values are still low (~30%), indicating longer-term trends are still recovering.
➡ Conclusion: Short-term breadth is very strong; mid-term is improving, but longer-term trend participation remains weak.
4. New Highs / New Lows
-
NH (New Highs) are still low (2.6% on May 2), but steadily rising.
-
NL (New Lows) are consistently below 1%, suggesting downside exhaustion.
➡ Conclusion: Though few stocks are making new highs, downside pressure has almost vanished.

5. Weekly & Monthly Breadth Trends
-
Advancing Week (May 2): 71.1% — suggesting most stocks were up over the past 5 trading days.
-
Advancing Month: 65.7% — strong monthly breadth trend.
6. Three-Month Breadth: Still bearish skew:
-
Decliners (70.5%) dominate
-
Only 4% of stocks are up more than 25% in 3 months
➡ Conclusion: Short- and mid-term breadth is recovering well, but the long-term trend is still healing from prior weakness.
7. Overall Market Breadth Conclusion
The data suggests that the market is undergoing a strong short-term bullish reversal:
-
The number of advancing stocks is rising consistently.
-
Momentum (as shown by 4%+ up moves) is accelerating.
-
Participation above key SMAs (especially 20- and 50-day) is broadening.
-
New lows are drying up, and weekly/monthly trends are turning positive.
-
Be aware, the long-term strength remains weak, with most stocks still below their 100- and 200-day SMAs and few breakout performers in the 3-month horizon.
244.22
+21.36 (+9.58%)
517.81
-7.95 (-1.51%)
270.37
-1.03 (-0.38%)
202.49
-0.4 (-0.2%)
648.35
-18.12 (-2.72%)
Find more stocks in the Stock Screener
AMZN Latest News and Analysis