
Why the high growth investor may take a look at NASDAQ:AMZN.
By Mill Chart
Last update: Nov 29, 2024
AMAZON.COM INC (NASDAQ:AMZN) has been identified as a Technical Breakout Setup Pattern by our stock screener. This pattern typically occurs when a stock takes a pause after a significant rise, indicating the possibility of a continuation in the trend. While it's impossible to predict with certainty, it might be beneficial to monitor NASDAQ:AMZN.
Insights from Technical Analysis
ChartMill assigns a proprietary Technical Rating to each stock. The score is computed daily by evaluating various technical indicators and properties. The score ranges from 0 to 10.
We assign a technical rating of 10 out of 10 to AMZN. This is due to a consistent performance in both the short and longer term time frames. Also compared to the overall market, AMZN is showing a nice and steady performance.
- The long and short term trends are both positive. This is looking good!
- Looking at the yearly performance, AMZN did better than 82% of all other stocks. On top of that, AMZN also shows a nice and consistent pattern of rising prices.
- AMZN is one of the better performing stocks in the Broadline Retail industry, it outperforms 80% of 32 stocks in the same industry.
- AMZN is currently trading in the upper part of its 52 week range. The S&P500 Index however is currently trading near a new high, so AMZN is lagging the market slightly.
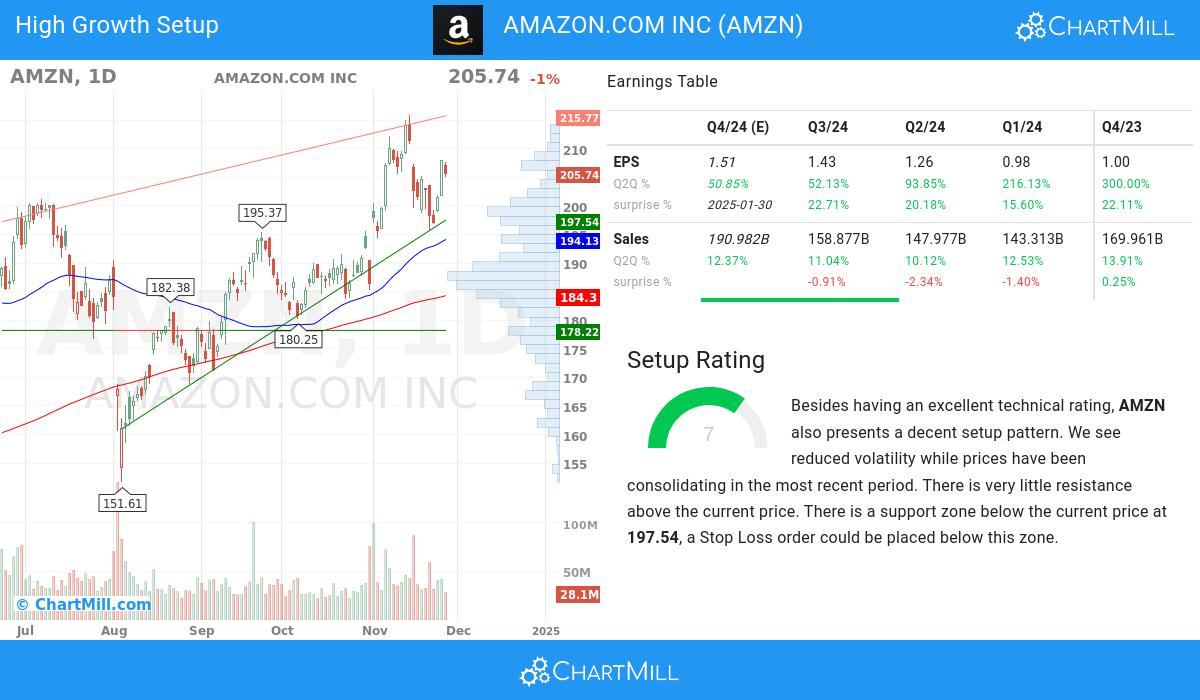
- In the last month AMZN has a been trading in the 185.23 - 215.90 range, which is quite wide. It is currently trading in the middle of this range where prices have been consolidating recently, this may present a good entry opportunity, but some resistance may be present above.
Check the latest full technical report of AMZN for a complete technical analysis.
Why is NASDAQ:AMZN a setup?
Besides the Technical Rating, ChartMill assigns a Setup Rating to every stock to determine the degree of consolidation. This rating, ranging from 0 to 10, is updated daily and evaluates various short-term technical indicators. NASDAQ:AMZN currently holds a 7 as its setup rating, suggesting a particular level of consolidation in the stock.
AMZN has an excellent technical rating and also presents a decent setup pattern. Prices have been consolidating lately and the volatility has been reduced. There is very little resistance above the current price. There is a support zone below the current price at 197.54, a Stop Loss order could be placed below this zone.
Why NASDAQ:AMZN may be interesting for high growth investors.
- The earnings per share (EPS) of AMAZON.COM INC have shown positive growth on a quarter-to-quarter (Q2Q) basis, with a 52.13% increase. This reflects the company's ability to improve its profitability over time.
- The average next Quarter EPS Estimate by analysts was adjusted by 18.41%, reflecting the evolving market expectations for the company's EPS growth.
- The quarterly earnings of AMAZON.COM INC have shown a 52.13% increase compared to the previous quarter, as revealed in the recent financial report. This growth signifies positive momentum in the company's financials, pointing towards a promising upward trend
- The operating margin of AMAZON.COM INC has seen steady growth over the past year, signaling improved profitability. This trend indicates the company's effective cost management and its ability to generate higher returns.
- With a favorable trend in its free cash flow (FCF) over the past year, AMAZON.COM INC demonstrates its ability to generate robust cash flows and maintain financial stability. This growth reflects the company's focus on efficient capital allocation and cash management.
- The Return on Equity (ROE) of AMAZON.COM INC stands at 19.24%, reflecting the company's strong profitability and effective utilization of shareholder equity. This metric signifies the company's ability to generate returns for its investors.
- With a Debt-to-Equity ratio at 0.28, AMAZON.COM INC showcases its prudent financial management. The company's balanced approach between debt and equity reflects its commitment to maintaining a stable capital structure.
- The ownership composition of AMAZON.COM INC reflects a balanced investor ecosystem, with institutional shareholders owning 68.56%. This indicates a broader market participation and potential for increased trading liquidity.
- AMAZON.COM INC has consistently exceeded EPS estimates in the last 4 quarters, demonstrating its ability to outperform market expectations. This trend highlights the company's strong financial performance and its potential for future growth.
- AMAZON.COM INC has maintained a healthy Relative Strength (RS) over the analyzed period, with a current 82.75 rating. This demonstrates the stock's ability to outperform its peers and indicates its competitive positioning. AMAZON.COM INC is well-positioned for potential price growth opportunities.
More ideas for high growth momentum breakouts can be found on ChartMill in our High Growth Momentum Breakout screen.
Disclaimer
This article should in no way be interpreted as advice. The article is based on the observed metrics at the time of writing, but you should always make your own analysis and trade or invest at your own responsibility.
200.99
-2.11 (-1.04%)
Find more stocks in the Stock Screener
AMZN Latest News and Analysis
 2 days ago - ChartmillFriday's session: most active stock in the S&P500 index
Looking for the most active S&P500 stocks in today's session? Join us as we dive into the US markets on Friday and discover the stocks that are dominating the trading activity and setting the pace for the market.
 2 days ago - ChartmillMarket Monitor News May 23 (Snowflake, Urban Outfitters UP - SolarEdge Technologies, Sunrun DOWN)
Wall Street Calms After Budget Jitters – Green Energy Tumbles, Alphabet Shines
 4 days ago - ChartmillAMAZON.COM INC (NASDAQ:AMZN) - A Strong Growth Stock with a Technical Breakout Pattern
AMAZON.COM INC (NASDAQ:AMZN) shows strong earnings growth and a bullish technical setup, making it a potential candidate for growth investors.
 10 days ago - ChartmillWhat's going on in today's session: S&P500 movers
Join us in exploring the top gainers and losers within the S&P500 index one hour before the close of the markets on Thursday as we examine the latest happenings in today's session.
10 days ago - ChartmillWhat's going on in today's session: S&P500 most active stocksLooking for the most active S&P500 stocks in today's session? Join us as we dive into the US markets on Thursday and discover the stocks that are dominating the trading activity and setting the pace for the market.
 11 days ago - ChartmillMarket Monitor News May 14 ( Tech UP - Healthcare stocks DOWN)
Wall Street Rises as Inflation Eases and Trade Optimism Grows
12 days ago - ChartmillWhich S&P500 stocks are the most active on Tuesday?Stay informed about the most active S&P500 stocks in today's session as we take a closer look at what's happening on the US markets on Tuesday. Discover the stocks that are generating the highest trading volume and driving market activity.
 12 days ago - ChartmillMarket Monitor News May 12 ( NRG Energy, Amazon, Meta Platforms UP - CVS Health DOWN)
Wall Street Surges on Temporary Trade Truce Between US and China
13 days ago - ChartmillWhich S&P500 stocks are the most active on Monday?Looking for the most active stocks in the S&P500 index on Monday? Dive into today's session and discover the stocks that are dominating the trading activity and setting the pace for the market.
 13 days ago - ChartmillTop S&P500 movers in Monday's pre-market session
Get insights into the top gainers and losers in the S&P500 index of Monday's pre-market session.
20 days ago - ChartmillThese S&P500 stocks are the most active in today's sessionExplore the S&P500 index on Monday and find out which stocks are the most active in today's session. Stay updated with the stocks that are capturing market interest.
 20 days ago - ChartmillMarket Monitor May 5 ( Meta UP - Apple DOWN)
Wall Street rallies for 9th straight session on strong US jobs data and trade optimism; Apple stumbles, Buffett announces retirement.
