
Why NASDAQ:AMD Is a Standout High-Growth Stock in a Consolidation Phase.
By Mill Chart
Last update: Feb 17, 2025
In this article, we'll take a closer look at ADVANCED MICRO DEVICES (NASDAQ:AMD) as a potential candidate for growth investing. While it's important for investors to conduct their own research, ADVANCED MICRO DEVICES has piqued our interest by appearing on our strong growth and breakout radar. Let's explore further.
Deciphering NASDAQ:AMD's Growth Rating
To evaluate a stock's growth potential, ChartMill utilizes a Growth Rating on a scale of 0 to 10. This comprehensive assessment considers various growth aspects, including historical and estimated EPS and revenue growth. NASDAQ:AMD has achieved a 9 out of 10:
- The Earnings Per Share has grown by an impressive 25.28% over the past year.
- AMD shows a strong growth in Earnings Per Share. Measured over the last years, the EPS has been growing by 38.99% yearly.
- Looking at the last year, AMD shows a quite strong growth in Revenue. The Revenue has grown by 13.69% in the last year.
- The Revenue has been growing by 30.81% on average over the past years. This is a very strong growth!
- The Earnings Per Share is expected to grow by 37.03% on average over the next years. This is a very strong growth
- Based on estimates for the next years, AMD will show a very strong growth in Revenue. The Revenue will grow by 21.87% on average per year.
Health Examination for NASDAQ:AMD
ChartMill employs a unique Health Rating system for all stocks. This rating, ranging from 0 to 10, is determined by analyzing various liquidity and solvency ratios. For NASDAQ:AMD, the assigned 7 for health provides valuable insights:
- AMD has an Altman-Z score of 10.15. This indicates that AMD is financially healthy and has little risk of bankruptcy at the moment.
- With an excellent Altman-Z score value of 10.15, AMD belongs to the best of the industry, outperforming 81.48% of the companies in the same industry.
- The Debt to FCF ratio of AMD is 0.72, which is an excellent value as it means it would take AMD, only 0.72 years of fcf income to pay off all of its debts.
- With an excellent Debt to FCF ratio value of 0.72, AMD belongs to the best of the industry, outperforming 81.48% of the companies in the same industry.
- A Debt/Equity ratio of 0.03 indicates that AMD is not too dependend on debt financing.
- A Current Ratio of 2.62 indicates that AMD has no problem at all paying its short term obligations.
Exploring NASDAQ:AMD's Profitability
Discover ChartMill's exclusive Profitability Rating, a proprietary metric that assesses stocks on a scale of 0 to 10. It takes into consideration various profitability ratios and margins, both in absolute terms and relative to industry peers. Notably, NASDAQ:AMD has achieved a 6:
- The 3 year average ROIC (1.56%) for AMD is below the current ROIC(2.66%), indicating increased profibility in the last year.
- AMD's Profit Margin has improved in the last couple of years.
- With a decent Operating Margin value of 7.90%, AMD is doing good in the industry, outperforming 61.11% of the companies in the same industry.
- With a decent Gross Margin value of 49.35%, AMD is doing good in the industry, outperforming 63.89% of the companies in the same industry.
- AMD's Gross Margin has improved in the last couple of years.
How does the Setup look for NASDAQ:AMD
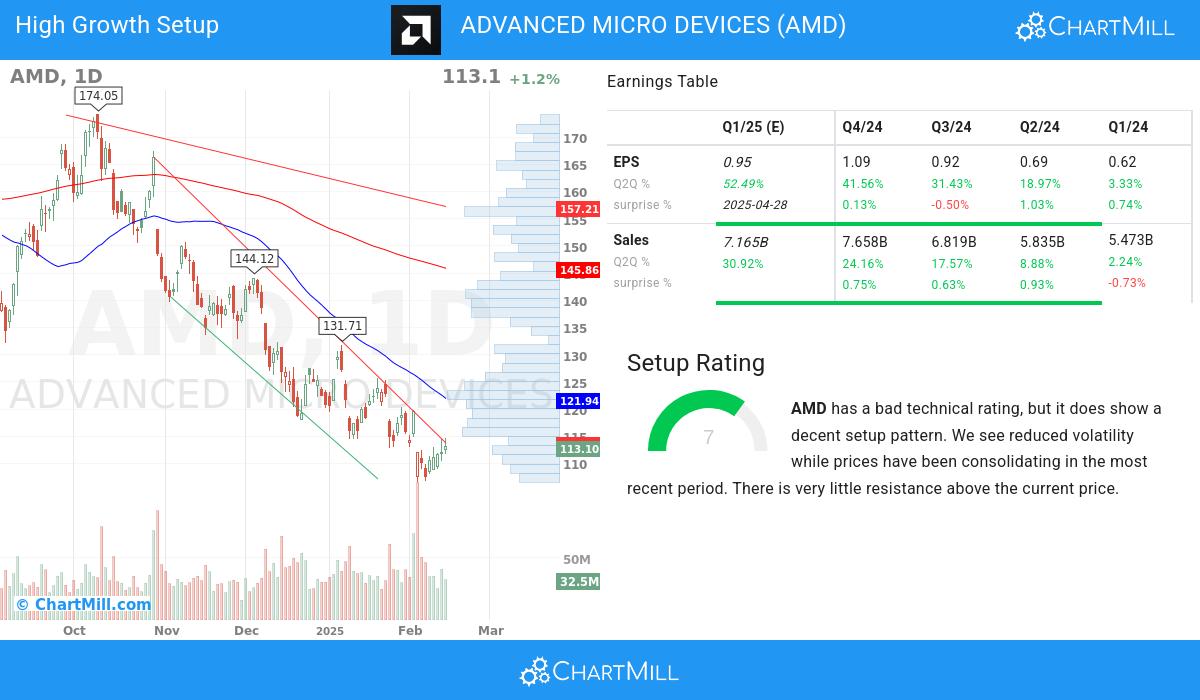
ChartMill takes into account not only the Technical Rating but also assigns a Setup Rating to each stock. This rating, on a scale of 0 to 10, reflects the degree of consolidation observed based on short-term technical indicators. Currently, NASDAQ:AMD exhibits a 7 setup rating, indicating its consolidation status in recent days and weeks.
AMD has a bad technical rating, but it does show a decent setup pattern. We see reduced volatility while prices have been consolidating in the most recent period. There is very little resistance above the current price.
Every day, new Strong Growth stocks can be found on ChartMill in our Strong Growth screener.
Our latest full fundamental report of AMD contains the most current fundamental analsysis.
Our latest full technical report of AMD contains the most current technical analsysis.
Disclaimer
This is not investing advice! The article highlights some of the observations at the time of writing, but you should always make your own analysis and invest based on your own insights.
221.08
-2.39 (-1.07%)
Find more stocks in the Stock Screener
AMD Latest News and Analysis


