
Peter Lynch’s investment strategy, described in One Up on Wall Street, centers on finding companies with steady growth at fair prices, commonly known as the Growth at a Reasonable Price (GARP) method. The approach prioritizes solid fundamentals, earnings strength, and financial stability while steering clear of overvalued or highly indebted firms. Applied Materials Inc (NASDAQ:AMAT) appears to align with this strategy based on key screening factors.
Why AMAT Matches the Peter Lynch Strategy
-
Earnings Growth (EPS 5Y: 23.2%)
Lynch looked for firms with steady earnings growth between 15% and 30%, as extremely high growth can be hard to maintain. AMAT’s five-year EPS growth of 23.2% fits this range, showing solid yet sustainable progress. The company’s semiconductor equipment business has gained from long-term industry trends, such as the need for advanced chipmaking tools. -
Fair Valuation (PEG Ratio: 0.74)
The PEG ratio (Price/Earnings to Growth) adjusts the P/E ratio for growth, with a figure below 1 indicating the stock might be undervalued compared to its earnings potential. AMAT’s PEG of 0.74 suggests its growth outlook isn’t fully priced in—a key trait of Lynch’s preferred stocks. -
High Profitability (ROE: 35.6%)
Return on Equity (ROE) shows how well a company turns shareholder equity into profits. AMAT’s 35.6% ROE surpasses Lynch’s 15% benchmark and ranks among the best in its sector, reflecting efficient capital use and strong operations. -
Moderate Debt (Debt/Equity: 0.33)
Lynch favored firms with low debt, ideally a Debt/Equity ratio under 0.25. While AMAT’s 0.33 is slightly higher, it stays below the screener’s 0.6 cap and points to a stable financial setup. The company’s solid free cash flow relative to debt (Debt/FCF: 1.07) also lowers risk. -
Liquidity and Stability (Current Ratio: 2.46)
A Current Ratio above 1 means a company can cover short-term bills. AMAT’s 2.46 shows good liquidity, though it’s a bit below some peers—a gap balanced by its strong earnings and financial health.
Additional Strengths Beyond the Screen
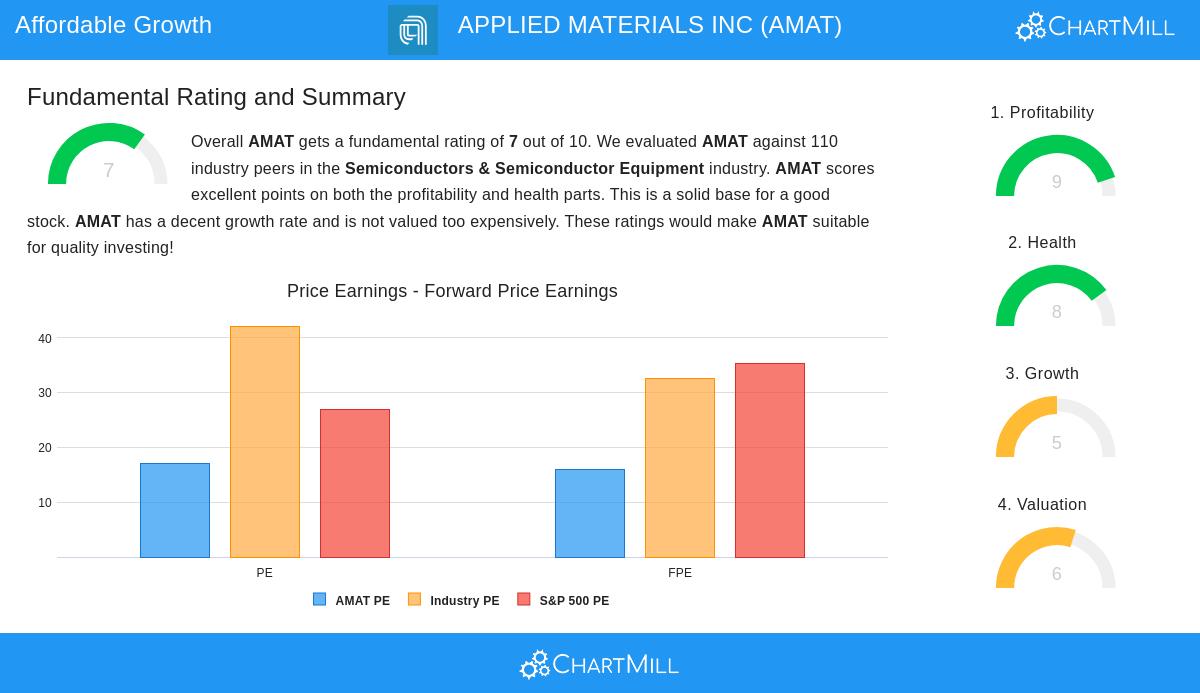
Our fundamental analysis report gives AMAT a score of 7/10, noting:
- Exceptional profitability: Leading margins (Operating Margin: 29.7%) and ROIC (27.9%) put AMAT at the top of its field.
- Sound financials: A high Altman-Z score (9.61) and controlled debt levels cut bankruptcy concerns.
- Fair pricing: While the P/E (17.09) seems high alone, it’s reasonable compared to peers and backed by growth.
- Dividend growth: A small but rising dividend (5-year CAGR: 12%) with a safe payout ratio (~19%).
Sector Trends and Challenges
AMAT works in the semiconductor equipment industry, a key part of global tech infrastructure. Long-term demand comes from AI, IoT, and advanced manufacturing. Still, shifts in semiconductor spending and supply-chain risks need watching.
Finding More Peter Lynch Picks
For those searching for similar stocks, our Peter Lynch Stock Screener offers a filtered list of firms meeting these standards.
Disclaimer: This analysis is not investment advice. Do your own research or consult a financial advisor before investing.