
Peter Lynch’s investment strategy, described in One Up on Wall Street, highlights finding companies with steady growth, fair valuations, and solid financials. His method combines growth and value investing, targeting businesses that maintain earnings growth without taking on too much risk. The strategy focuses on key financial measures like earnings growth, profitability, and balance sheet stability while steering clear of high debt or unstable expansion. Applied Materials Inc (NASDAQ:AMAT) stands out as a company that matches these ideas, positioning it as a possible choice for investors looking for growth at a reasonable price (GARP) over the long term.
Why Applied Materials Matches the Peter Lynch Approach
-
Consistent Earnings Growth
Lynch liked companies with stable earnings growth, usually between 15% and 30%. Applied Materials has achieved a five-year EPS growth rate of 23.2%, fitting well within this range. This shows the company has grown profits at a steady rate without relying on temporary boosts. -
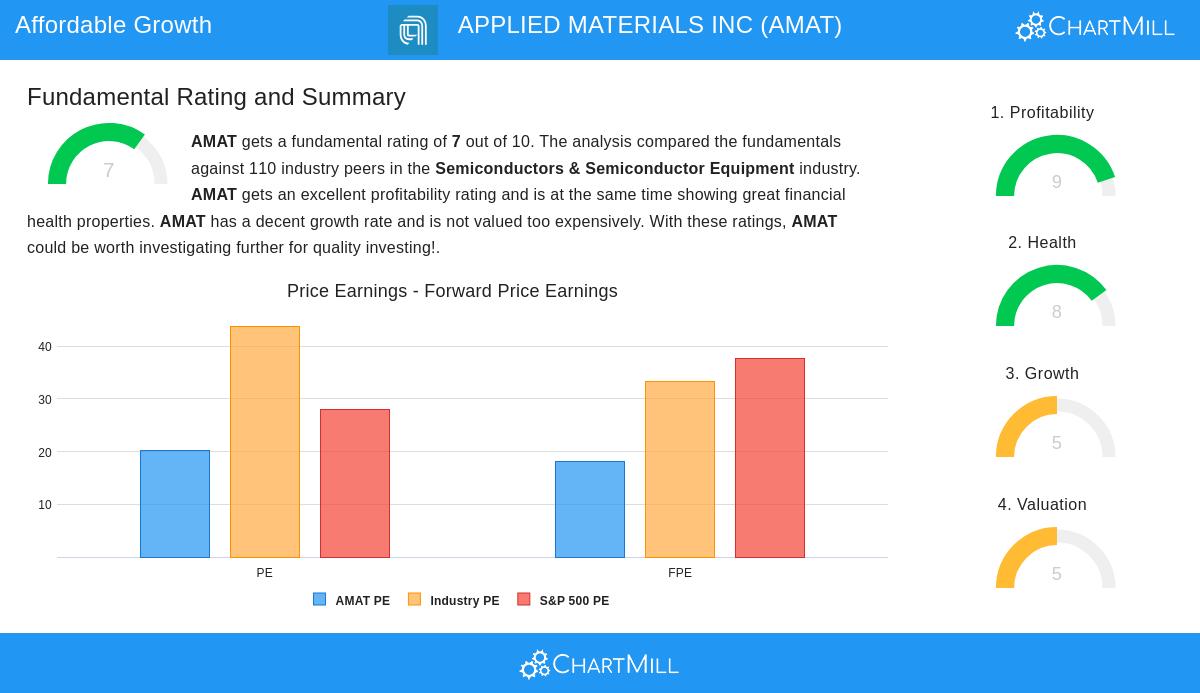
Fair Valuation Compared to Growth (PEG Ratio)
A critical measure in Lynch’s approach is the PEG ratio, which accounts for growth when evaluating the P/E ratio. A PEG below 1 suggests a stock might be undervalued relative to its growth potential. Applied Materials’ PEG ratio of 0.87 indicates the stock is priced modestly despite its strong past growth. -
High Profitability (ROE)
Return on equity (ROE) shows how well a company uses shareholder equity to generate profits. Lynch sought ROEs above 15%, and Applied Materials performs well here with an ROE of 35.6%, far exceeding the target. This points to efficient use of capital and a strong position in its sector. -
Low Debt (Debt/Equity Ratio)
Lynch favored companies with little debt, ideally a debt-to-equity ratio below 0.25. Applied Materials’ ratio of 0.33 is slightly higher but still low compared to many competitors, reflecting a reasonable debt level. The company’s strong cash flow also eases any worries about borrowing. -
Good Liquidity (Current Ratio)
A current ratio above 1 means a company can cover short-term obligations. Applied Materials’ current ratio of 2.46 shows it has plenty of liquidity, lowering financial risk—an important factor for long-term investors.
Key Financial Strengths in the Review
The fundamental report for Applied Materials highlights its sound financial condition:
- Profitability: The company scores well on margins (operating margin of 29.7%) and capital efficiency (ROIC of 27.9%), doing better than most peers in the semiconductor equipment sector.
- Balance Sheet: With an Altman-Z score of 10.4 and a controlled debt level, the risk of financial trouble is minimal.
- Growth Outlook: While revenue growth may slow, EPS growth is forecast at 10.3% per year, still respectable for an established company.
Final Thoughts
Applied Materials aligns with the main principles of Peter Lynch’s strategy: steady growth, fair valuation, and financial strength. Its high profitability, careful debt management, and industry standing make it a strong option for GARP investors aiming for long-term gains.
For more stocks that fit this approach, check the Peter Lynch Stock Screener.
Disclaimer: This article is not investment advice. Do your own research or consult a financial advisor before making investment decisions.