
TRADERS - Sizing Positions - Part 3
Published on Chartmill with kind permission of TRADERS’ Magazine. Check the original PDF article here
Trading and investing is simple, very simple actually. Particularly in financial markets. Because all we can do there, is just buy and sell stuff. Yet at this very basic level of making decisions, things already start to go awfully wrong. So however simple it may be, it sure isn’t easy. In this article series we explain the single most important formula any trader and investor should know. In fact, it’s probably the only formula everyone should know about in life. And we’ll discover how most people who know the formula already, probably interpret and apply it the wrong way. In this article we’ll look into the nitty gritty of sizing positions.
In the first two articles of this series we introduced expectancy as a way to measure overall profitability of a system. This is surely nothing new to any trader who has been around for even just a little while. But we cannot use it in a quantitative way, as much as some may believe the opposite to hold true. This formula isn’t about predicting system quality, it’s about control and effort! It tells us what 20% of our efforts can control 80% of our results, by focusing on minimizing each loss and maximizing every winner, when they present themselves as such.
We can minimize our average loss by minimizing each loss. Over this we have the ultimate control, since the only thing we need to do is pull the trigger and sell the loss. This can be done by the click of a mouse, nowadays. The same can be said for the average profit, which can be controlled simply by taking care of each profit. All of this was explained in the second article of this series.
Risk versus reward
Without doubt, whole libraries are written on the subject of risk and reward. But in the end, it’s clear they are related. It’s the basis of postponed but greater rewards, given the concept of investing. Strangely enough most people take as common wisdom the fact that more profit invariably comes from taking on more risk. This is not true. Steady growth of capital mainly comes from figuring out risk, respecting it and not taking on too much of it. Take the example of a coin toss where we double our stake with each head but lose it when tails come up. This is, according to expectancy, a profitable deal, because we know for sure that the longer we play the more the number of heads and tails will converge towards half of all throws. Something we cannot know in financial markets. Yet even this profitable game can blow us up easily by taking on too much risk. Going all in, for example, is all one has to do to lose everything for sure when playing continues. All it takes is one loss to wipe out the gambler. So risking more might create an outlook on having bigger winners, but the true risk comes from not being able to play the game long enough, even if we know it will be profitable. What’s more, one can not only take on too much risk but also too little. For the coin toss example, profits are maximized risking 25% each time. Keep in mind though that having 4 losses in a row (a probability of 6,25%) will take down equity by 57,81%. So risk also has a relationship with volatility. If two systems brings us the same profit, we want the safe bus trip taking us there, rather than the rollercoaster ride.
Risk is mainly controlled by sticking to lots of liquidity and the size of a position and is technically implemented by means of stop orders and bought options (contrary to written options). If, for the sake of simplicity, we leave out margin and leverage, risk is directly related to what is invested. Given that we only can lose what we invest (again, leaving out of the discussion any leverage), what we invest is what we risk. If we invest lager amounts, resulting in bigger positions, we will get greater equity volatility. The whole idea is to limit volatility to the down side while keeping it on the up side. If we don’t do that, we are doomed to fail, because of the asymmetrical percentage nature of losses versus profits. Any percentage down can only be made up for by a greater percentage up. So more volatility in both directions draws down equity over time (as does leverage, by the way, again if we don’t take care of limiting the downside).
What to risk
Looking at risk as what we invest, is completely unacceptable and not workable. On the one hand risking less would mean investing less, limiting what we can make. Second of all, costs (commissions and taxes) would overrun any attempt to come out ahead if we would risk only small parts. The key to solving this problem is to try and disconnect what we risk from what we invest. This is in fact possible, only if we could limit the downside. This can easily be done by using a stop loss or defining risk very sharply by translating the position into an option position. Using options would even weed out the risk of gaps that comes with conditional orders like stop losses. We will, however, not go into the technicalities of using options. Instead we can build our case here assuming stops are perfect. To close this point, stops will work better if liquidity is looked after properly (the same holds true for options) and by using exit stops without a limit. Entry stops on the other hand should come with a limit. The logic behind this is that opportunities are everywhere, all the time. There always will be another train we can take. So if slippage on the entry is avoided by using a limit, the downside would only be that an entry possibly could be missed. On the other hand, if trouble comes knocking, we need to get out the position first and foremost, at all cost. Limiting losses is not where we want to nibble off a few cents, while risking a stop not getting us out of a position. Also certain industries (like biotechnology and renewable energy) are far more riskier than most others. So if one invests there, a thorough due diligence is absolutely essential.
Taking all of the above into account, we will define risk as the open risk of a position. This is the capital at risk that is not protected by the stop loss. As an example, take a stock position we hold that’s been bought at $22.18, currently trading at $22.66 with a protective stop at $20.87. If we hold a hundred shares, our position’s current worth is $2266, the investment was $2218 but our initial risk is limited to ( 22.18 – 20.87 ) × 100 = $131. Our current exposure is ( 22.66 – 22.18 ) x 100 or $48. That amounts to only 5.91% of the investment being at risk. So what we invest, $2218, clearly isn’t what we risk, $131. Given that this position is only one in a portfolio being worth $10,000 the investment is 22,18% of our net worth, but the portfolio risk originating from this position is reduced to a mere 1,31%.
Position size
Once it’s clear the we don’t have to risk everything we invest, we can turn things around in our processing. Suppose we want to buy FB at $22.18 with an initial protective stop loss at $20.87. From these two levels we know we will risk $1.30 per share. Now if we want to risk only 1% of our equity, say for a total net worth of $13,254, in this position, then we can only risk $132.54. Given that we already take a risk of $1.30 dollar for each share we are going to buy, we can buy up to 132.54 / 1.30 or 101,95 shares. We round this off down to an nice 100 shares. What we have done here, is calculate the size of a position based on the total risk we want a position to bring into our portfolio and the risk per share we have to take on a technical basis to make the trade worthwhile. Nevertheless we only risk 1% of total equity, but we invest 100 × 22.18 / 13254 or 16.73% of our equity in this position. The position itself however will be stopped out at a loss no less than 5.91%. This money management algorithm is called ‘percent risk position sizing’.
The total equity we base our total risk on can be the total net worth of our portfolio. This will give us the biggest position. If we base our total risk only on the available cash, we will get a smaller position size. In between is the position size we’ll get if we take the initial risk on the protected total net worth of the portfolio. This would be the portfolio’s value if all positions were sold at their stop loss level. This gives a bigger position then risking only cash but isn’t as aggressive as assuming we already earned the paper profits to the full (which we never will, a position that gets stopped out will necessarily first have to decrease in value).
Another useful way to size positions is, again, starting from the risk we want to take, let’s go with the 1% of $13,254 once more. Instead of looking at the risk per share we turn our attention to the volatility of the stock. Suppose the ATR (average true range – this is the average daily range with gaps added to the range) of FB at the moment of purchase is $0.79. If we only want the FB position to have a daily volatility impact of 1% on our equity, given that each share brings in a volatility of $0.79, we’ll have to limit the volume we want to buy to 132.54 / 0.79 = 167.77 or 167 shares (one can also round this to an even 10 shares going with 160 instead of 167). This money management scheme is called ‘percent volatility position sizing’. It results in a portfolio where each position has an equal impact on the portfolio’s volatility.
Going life
The above position sizing algorithms are theoretically pure, but of course there’s also a reality to trading. There’s the impact of commissions, taxes, the possibility that stops will get hit by chance, and so on. On www.chartmill.com there’s a calculator taking care of all this on the advanced charts tab. Just key in your favorite tickers in the chart settings part. On any chart, you can choose ‘entry/exit/profit target goes here’, by clicking right on the chart. A screenshot is shown in figure 1. This will fill in the position sizing tool. Of course each of the numbers can be manually fine-tuned in the tool itself. You have to fill in entry, exit, capital and %risk. Single trip commission and tax percentage will need to be adjusted according to country and broker tariffs. Setting ‘rounding’ to ten, for instance, will round down the number to the next (lower) multiple of ten shares. If a profit target is set, more analysis will be done.
Have a look at figure 2, where we display the meanwhile familiar FB example used in this article. When everything is filled in (also the profit target), you’ll get the middle analysis screen of figure 2, stating total risk and total profit (when the profit target would be reached) in dollars and percentage of the capital presented at the input. Also the risk and profit per share are shown in dollars and percentage to the entry price. The suggested number of shares, here 73, according to the percent risk algorithm is displayed, followed by the rounded number of shares, here being 70. Both volumes are also presented as a percentage of average daily volume, which preferably would be so little that 0.00% should always be the displayed. Otherwise stocks with far more liquidity for this kind of equity need to be used. Next are the total investment and break-even price in dollars and the percentage of capital and entry price given. Then, we have the average true range in dollars and percentage of the entry price, followed by the stop distance in dollars and ATR multiples. In this case the stop distance is only 1.66 ATR, which is rather close and why the tool gives an alert (red). These are warning signs to the user. The more warning signs pop up, the less this trade should be considered. Do not ever tweak the input to get a warning free output. This is not good money management! Near the end, the tool states the stock’s average daily liquidity in number of shares and the days needed to transact the suggested rounded number of shares, which of course would also be as small as 0.0 days. Almost last but not least, the P/L ratio is given and also its reciprocal, the Risk Reward Ratio (RRR). The tool finally suggests a percent risk that could be filled in at the top if one wants to adjust risk to the P/L ratio. A better P/L will ask for a greater percent risk. This suggested risk of 1.35% is filled in in the most right screenshot of figure 2, changing the suggested position size from 70 to 60. So in this case, the tool advises to take less risk, based on the P/L ratio it sees. Wherever we mentioned dollars, of course one needs to follow the currency of the stock under analysis.
[FIGURE 1]

[HEAD] Using the position sizing tool on Chartmill.
[CAPTION] Figure 1: By clicking right on a chart, it is possible to directly enter data in the position sizing tool. In the position sizing section of the context menu one can choose to pinpoint the entry, exit or profit target to go with the point being clicked.
[FIGURE 2]
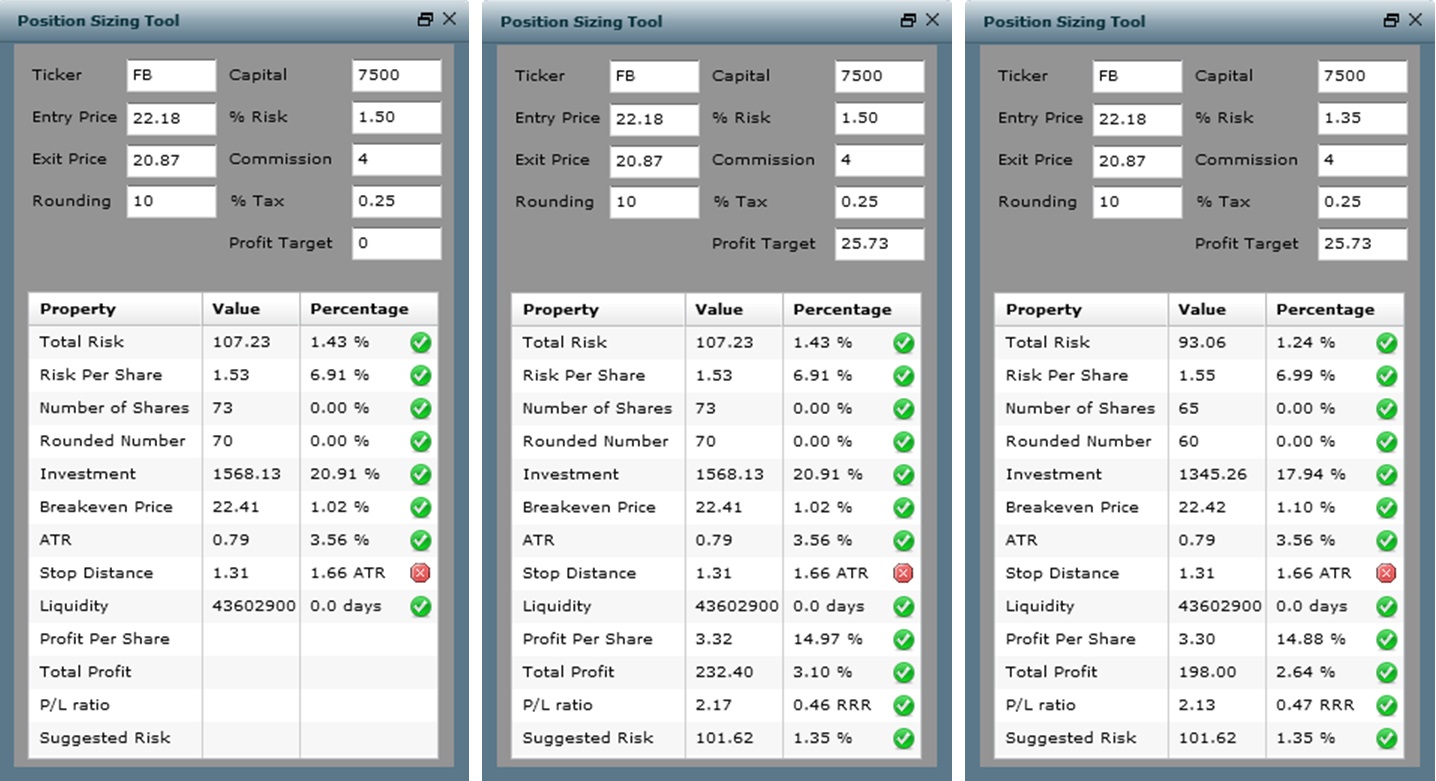
[HEAD] Using the position sizing tool on Chartmill (detail).
[CAPTION] Figure 2: Filling in all but a profit target in the upper part of the position sizing calculator, shows all of the feedback in the lower part of the left most screenshot. Adding a profit target fills out the rest of the feedback, as displayed in the middle. Taking the suggested risk into account and filling in its percentage, back at the top, leaves us with the screenshot on the right showing an advice to take on a lighter volume with this trade.
DIRK VANDYCKE is actively and independently studying the markets for over 15 year, with a focus on technical analysis, market dynamics and behavioral finance. He writes articles on a regular basis and develops software, which is partly available at his co-owned website www.chartmill.com. Holding master degrees in both Electronics Engineering and Computer Science, he teaches software development and statistics at a Belgian University. He’s also an avid reader of anything he can get his hands on. He can be reached at dirk@monest.net.